
The Money Flow Index (MFI) is a technical indicator that uses both price and volume data to measure buying and selling pressure. It was developed by Gene Quong and Avrum Soudack and was introduced in their 1994 book, “The Insider’s Guide to Trading the World Stock Markets.”
The MFI is calculated using a combination of price and volume data. It is a momentum indicator that measures the inflow and outflow of money in a security over a specified period. The MFI ranges from 0 to 100 and is often depicted as an oscillator that fluctuates between these two values.
The MFI works by analyzing the price and volume data of a security over a specific period, usually 14 days. The indicator is calculated by first calculating the typical price for each day, which is the average of the high, low, and close prices. Next, the money flow is calculated by multiplying the typical price by the volume traded on that day.
The money flow for each day is then categorized as either positive or negative. If the typical price for the day is higher than the previous day’s typical price, then it is considered a positive flow. Conversely, if the typical price for the day is lower than the previous day’s typical price, then it is considered a negative flow.
The MFI is then calculated by dividing the sum of positive money flows by the sum of negative money flows and multiplying the result by 100.
A reading above 80 is considered overbought, while a reading below 20 is considered oversold. Traders often use these levels as signals to buy or sell a security.
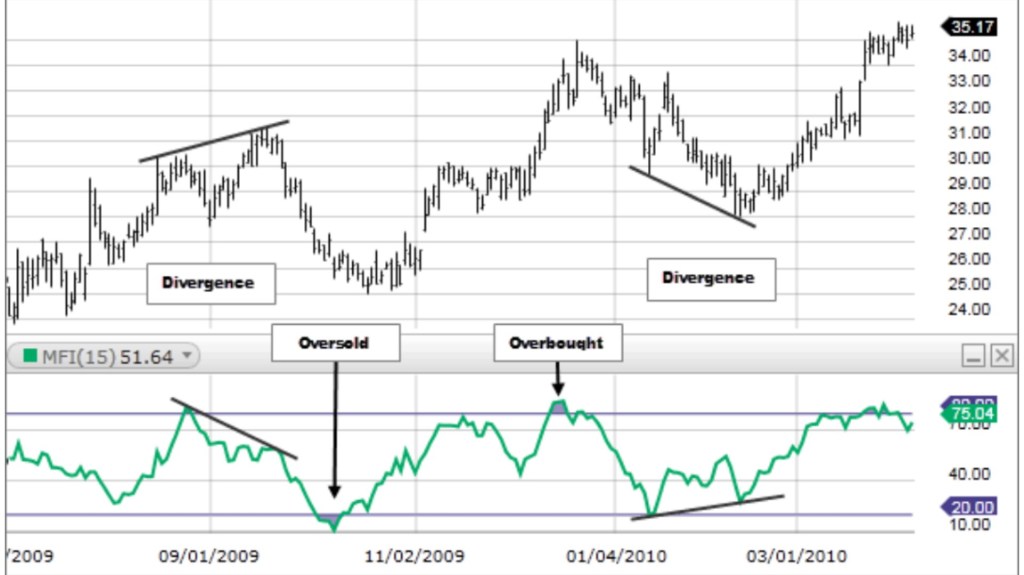
Let’s say a swing trader is analyzing the chart of a stock that has been in an uptrend for several weeks. The trader notices that the stock has been making higher highs, but the MFI has been making lower highs. This is a bearish divergence, which can indicate that the buying pressure in the stock is weakening.
The swing trader may use this information to look for a potential reversal in the stock’s price trend. They may wait for the stock to break below a key support level or a trendline before entering a short position. They may also use a stop loss order above the recent high to limit their potential losses.
This is just one example of how a swing trader can use the MFI to identify potential trading opportunities. Other traders may use the MFI in different ways, depending on their trading style and the securities they are analyzing.
The best settings for the MFI depend on the trading style and the security being analyzed. However, a common setting is 14 days. Traders may adjust this setting depending on the timeframe of their trading strategy.
In summary, the Money Flow Index (MFI) is a technical indicator that uses both price and volume data to measure buying and selling pressure in a security over a specified period. The MFI ranges from 0 to 100 and is often depicted as an oscillator that fluctuates between these two values. Traders can use the MFI to identify potential reversals in a security’s price trend, short-term price movements, or confirm a long-term trend in a security. The best settings for the MFI depend on the trading style and the security being analyzed, and it can be used in combination with other indicators such as moving averages or trendlines.

Leave a reply to A D Cancel reply