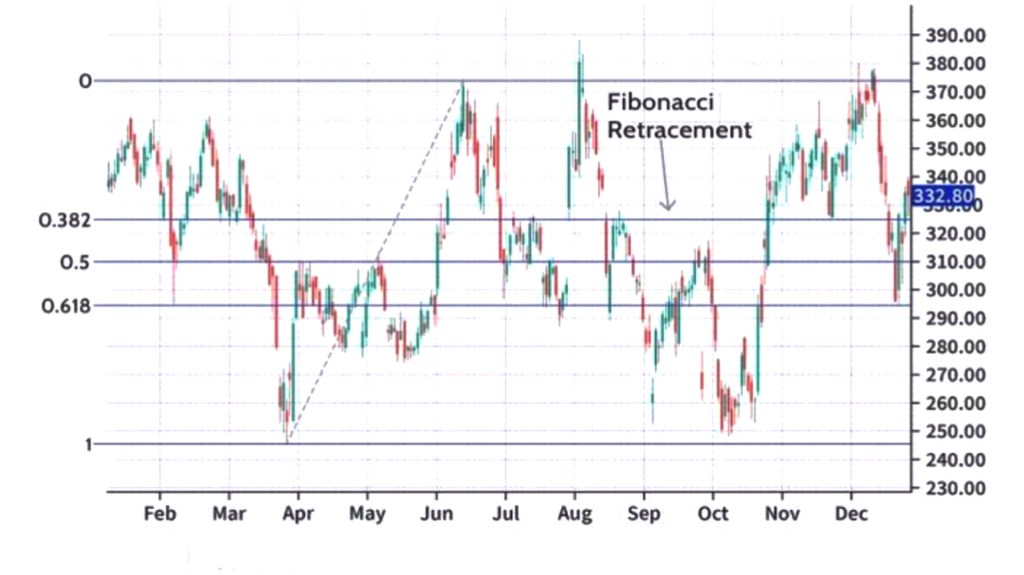
Fibonacci Retracement is a technical analysis tool used in trading to identify potential levels of support and resistance in a market. It is based on the idea that markets tend to retrace a predictable portion of a move, after which they continue in the original direction.
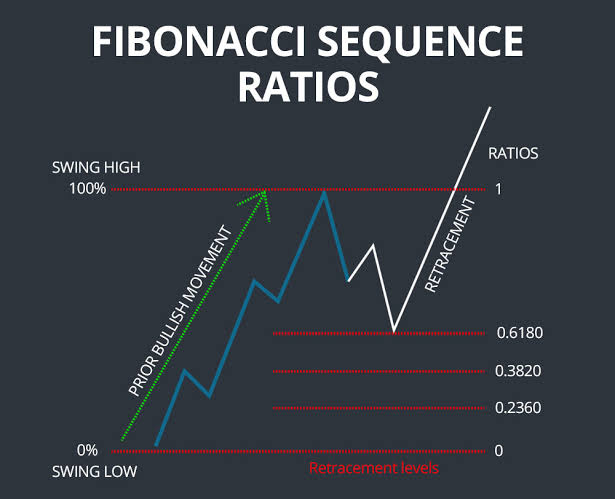
The indicator uses horizontal lines to indicate areas of potential support or resistance at the key Fibonacci levels before the price continues its original move. The key levels are 23.6%, 38.2%, 50%, 61.8%, and 100%. These levels are derived from the Fibonacci sequence, a series of numbers where each number is the sum of the two preceding numbers (e.g., 0, 1, 1, 2, 3, 5, 8, 13, 21, 34, etc.).
To use the Fibonacci Retracement tool, you first identify the high and low points of a trend or move in a market. Then, you apply the Fibonacci levels to that move, from the high point to the low point. The indicator will automatically draw the horizontal lines at the Fibonacci levels.
For example, let’s say the price of a stock moves from ₹50 to ₹70 before retracing back to ₹60. You would apply the Fibonacci levels to the move from ₹50 to ₹70, and the indicator will draw the horizontal lines at the key Fibonacci levels (23.6%, 38.2%, 50%, 61.8%, and 100%). These levels will act as potential support or resistance levels for the price as it continues its move.
As for the best settings for the indicator, there is no one-size-fits-all answer. It depends on the market being analyzed and the time frame being used. Traders can experiment with different settings and time frames to find the ones that work best for their trading strategy.
The Fibonacci Retracement indicator can be used in conjunction with other indicators, such as trend lines, moving averages, and oscillators, to confirm potential support and resistance levels. Traders can also use it to identify potential entry and exit points for trades.
To summarize, the Fibonacci Retracement indicator is a popular tool used in trading to identify potential levels of support and resistance in a market. It is based on the key Fibonacci levels derived from the Fibonacci sequence. Traders can experiment with different settings and time frames to find the ones that work best for their trading strategy, and can use it in conjunction with other indicators to confirm potential levels and identify entry and exit points for trades.
Fibonacci Retracement indicator is related to the Golden Ratio. The Golden Ratio is a mathematical ratio of 1.618:1, which is also known as Phi (φ). It is derived from the Fibonacci sequence, where each number is the sum of the two preceding numbers, and the ratio of consecutive numbers approaches the Golden Ratio as the sequence progresses.
The Golden Ratio is found in many natural and man-made objects, such as the spiral shape of seashells, the branching of trees, and the design of some buildings and art. It is also used in trading as a potential level of support and resistance.
In the Fibonacci Retracement tool, the key Fibonacci levels are derived from the Golden Ratio. The levels are 23.6%, 38.2%, 50%, 61.8%, and 100%, and are calculated by multiplying the move by the Golden Ratio and subtracting the result from the high point or adding the result to the low point. These levels are believed to be significant levels where the price may reverse or continue its trend.
For example, the 61.8% level is calculated by multiplying the move by 0.618 and subtracting the result from the high point. This level is believed to be a significant level where the price may reverse or continue its trend.
Therefore, the Fibonacci Retracement indicator is related to the Golden Ratio, which is a mathematical ratio of 1.618:1. The key Fibonacci levels used in the indicator are derived from the Golden Ratio and are believed to be significant levels where the price may reverse or continue its trend. The Golden Ratio is found in many natural and man-made objects and is used in trading as a potential level of support and resistance.

Leave a reply to Scott Dubois Cancel reply