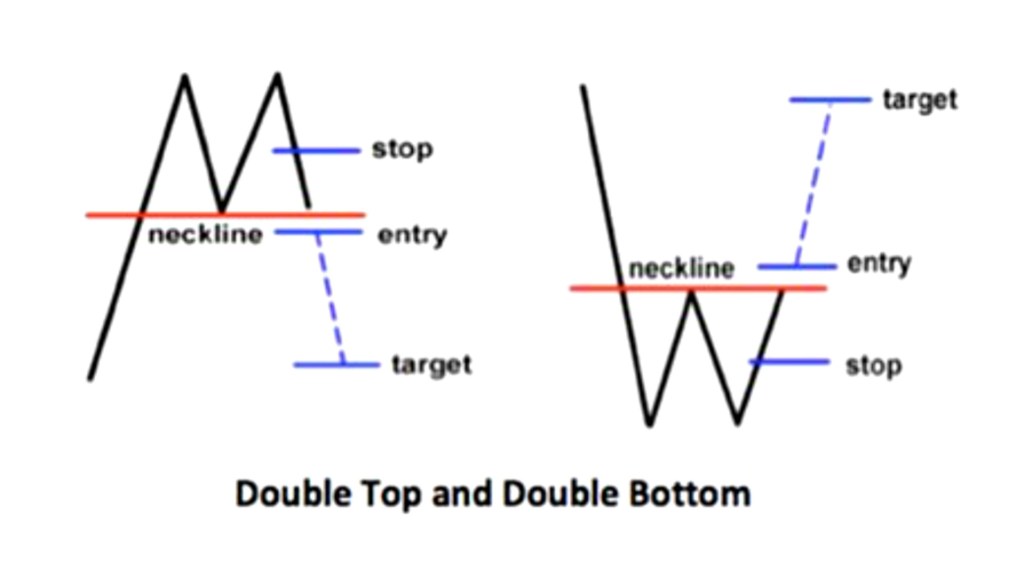
Double top and double bottom are common chart patterns used in technical analysis to identify potential trend reversal points in the stock market. The double top pattern occurs when a stock price reaches a high point twice and fails to break above it, forming two peaks at approximately the same price level. On the other hand, the double bottom pattern occurs when a stock price reaches a low point twice and fails to break below it, forming two troughs at approximately the same price level.
To interpret the double top and double bottom chart patterns, traders and investors usually look for the following key characteristics:
Double Top:
1) The two peaks should be at approximately the same price level.
2) The distance between the two peaks should not be too far apart.
3) The price should break below the support level, which is usually the price level between the two peaks.
Double Bottom:The two troughs should be at approximately the same price level.
The distance between the two troughs should not be too far apart.
The price should break above the resistance level, which is usually the price level between the two troughs.
The double top and double bottom patterns are often used by traders and investors as a signal to enter or exit a trade. For example, if a stock price forms a double top pattern, it may indicate that the bullish trend has ended, and a bearish trend is about to start. Traders may then sell their positions or take a short position to profit from the expected decline. Conversely, if a stock price forms a double bottom pattern, it may indicate that the bearish trend has ended, and a bullish trend is about to start. Traders may then buy the stock or take a long position to profit from the expected increase in price.
1) The two troughs should be at approximately the same price level.
2) The distance between the two troughs should not be too far apart.
3) The price should break above the resistance level, which is usually the price level between the two troughs.
The double top and double bottom patterns are often used by traders and investors as a signal to enter or exit a trade. For example, if a stock price forms a double top pattern, it may indicate that the bullish trend has ended, and a bearish trend is about to start. Traders may then sell their positions or take a short position to profit from the expected decline. Conversely, if a stock price forms a double bottom pattern, it may indicate that the bearish trend has ended, and a bullish trend is about to start. Traders may then buy the stock or take a long position to profit from the expected increase in price.
Here is an example of a double top pattern:
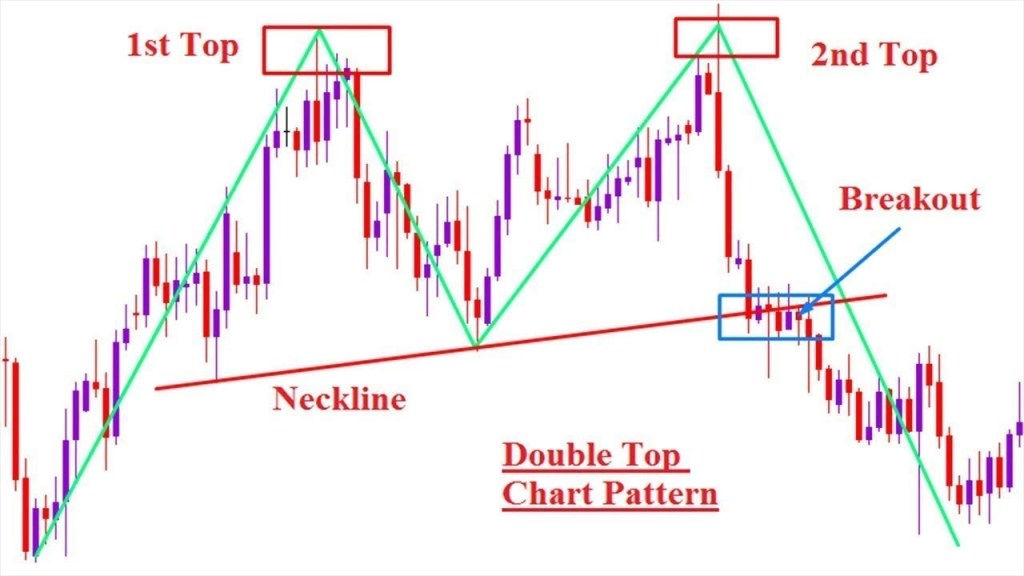
In this example, we can see that the stock price reached a high point twice at approximately the same price level and failed to break above it. The price then broke below the support level, indicating a potential trend reversal.
Here is an example of a double bottom pattern:
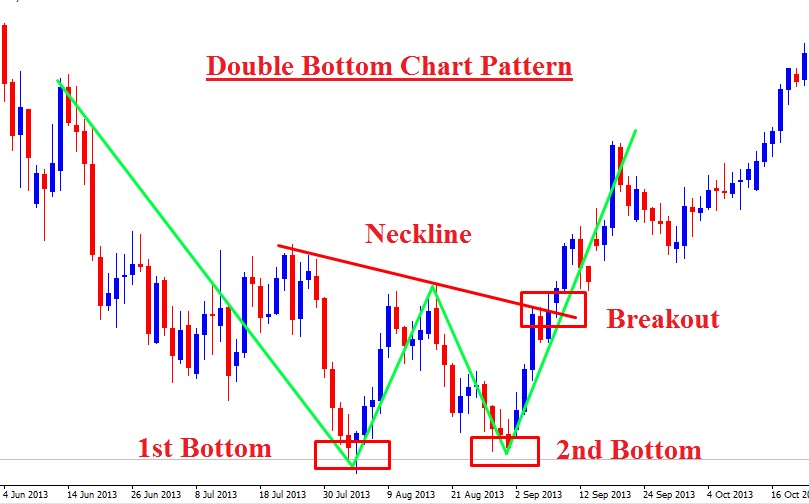
In this example, we can see that the stock price reached a low point twice at approximately the same price level and failed to break below it. The price then broke above the resistance level, indicating a potential trend reversal.
In summary, the double top and double bottom chart patterns are useful tools for identifying potential trend reversal points in the stock market. Traders and investors can use these patterns to make trading decisions based on the expected direction of the next trend. However, like all technical analysis tools, they are not foolproof and should be used in conjunction with other indicators and analysis methods for better accuracy.

Leave a comment