
Ascending Triangle and Descending Triangle are two important chart patterns used in technical analysis to predict the future price movement of a stock. These patterns are formed by two trend lines that converge to a point, indicating a potential breakout in the price.
An Ascending Triangle is formed by a horizontal resistance line and a rising trend line that connects a series of higher lows.
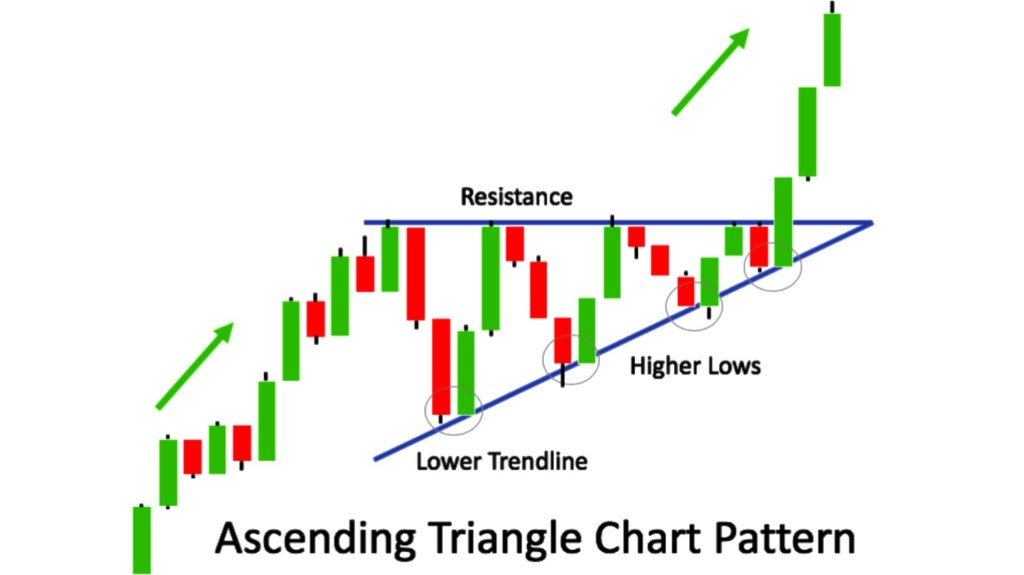
The horizontal resistance line is formed by multiple price highs, indicating a strong level of selling pressure. As the price approaches the resistance level, the buying pressure increases, causing the price to bounce back from the resistance level. When the price approaches the resistance level for the third time, there is a high probability of a breakout above the resistance level.
On the other hand, a Descending Triangle is formed by a horizontal support line and a falling trend line that connects a series of lower highs.

The horizontal support line is formed by multiple price lows, indicating a strong level of buying pressure. As the price approaches the support level, the selling pressure increases, causing the price to bounce back from the support level. When the price approaches the support level for the third time, there is a high probability of a breakout below the support level.
Traders and investors use these patterns to identify potential buy or sell signals in the market. In an Ascending Triangle, traders can buy the stock when the price breaks above the resistance level, indicating a bullish trend. In a Descending Triangle, traders can sell the stock when the price breaks below the support level, indicating a bearish trend.
It is important to note that these patterns are not always accurate and there can be false breakouts. Therefore, traders and investors should use other technical indicators and fundamental analysis to confirm their trading decisions.
In summary, Ascending Triangle and Descending Triangle are important chart patterns used in technical analysis to predict the future price movement of a stock. These patterns are formed by two trend lines that converge to a point, indicating a potential breakout in the price. Traders and investors use these patterns to identify potential buy or sell signals in the market, but should also use other technical indicators and fundamental analysis to confirm their trading decisions.

Leave a comment