
The Ultimate Oscillator (UO) is a technical analysis indicator used to analyze the stock market. It is a momentum oscillator that combines three different time periods to give a more accurate picture of a stock’s price movements. The UO is calculated by taking the weighted average of three different timeframes of the stock’s closing prices, usually 7, 14, and 28 periods.
The formula for the UO is as follows:
UO = [(4 * average of 7-period lows) + (2 * average of 14-period lows) + (average of 28-period lows)] / [(4 * average of 7-period highs) + (2 * average of 14-period highs) + (average of 28-period highs)] * 100
The UO ranges between 0 and 100, with overbought and oversold levels set at 70 and 30, respectively. A reading above 70 indicates that the stock is overbought and may be due for a price correction, while a reading below 30 suggests that the stock is oversold and may be ready to rebound.
The UO can be used in conjunction with other technical analysis indicators, such as moving averages, volume, and trend lines, to confirm trading signals. For example, if the UO gives a buy signal, traders may look for additional confirmation from other indicators before entering a trade.
There is no single “best” setting for the UO indicator, as it depends on the trader’s individual preferences and trading style. Some traders may prefer shorter timeframes, while others may prefer longer ones. It is important to experiment with different settings to find what works best for you.
Traders and investors use the UO in various ways, depending on their individual strategies. Some traders may use the UO to identify potential trend reversals, while others may use it to identify overbought and oversold conditions.
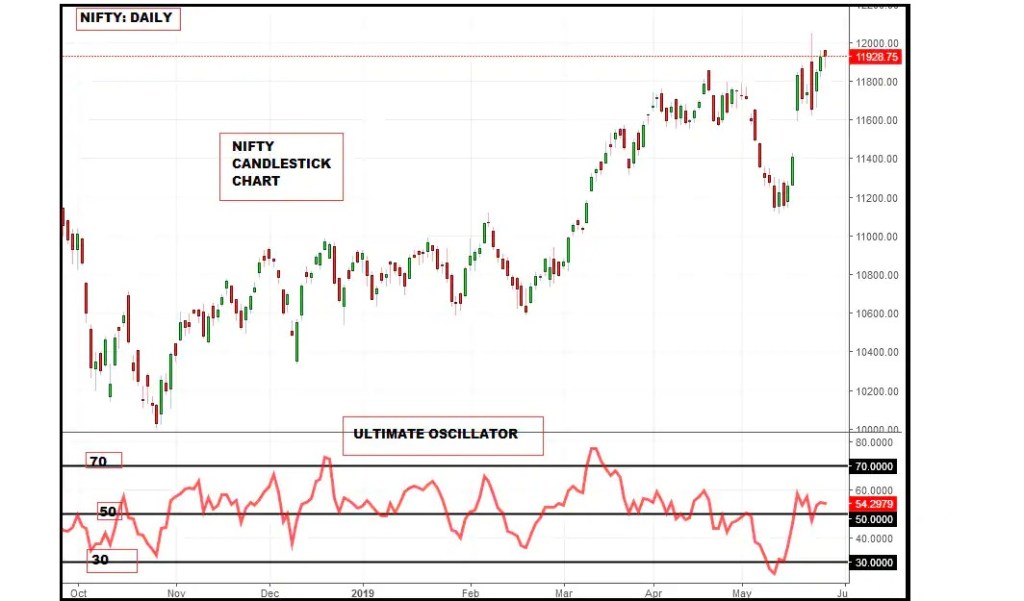
For example, if a stock’s UO reading is above 70, indicating an overbought condition, traders may look for a potential price reversal or correction. Conversely, if the UO reading is below 30, indicating an oversold condition, traders may look for a potential price rebound.
In summary, the Ultimate Oscillator is a momentum oscillator that combines three different timeframes to give a more accurate picture of a stock’s price movements. It is used to identify potential trend reversals and overbought and oversold conditions. Traders and investors can use it in conjunction with other technical analysis indicators to confirm trading signals and develop their own trading strategies.

Leave a comment