The Standard Deviation (SD) is a popular indicator used in technical analysis of the stock market. It is a statistical measurement that calculates the amount of variability or dispersion in a set of data points, typically a stock’s closing price over a given period. It is used to measure the volatility of a stock, which can help traders and investors to assess the risk of investing in that stock.
The Standard Deviation indicator is typically calculated using a set period of closing prices for a stock or an index. The calculation determines the average of the set of prices, then calculates the difference between each price and the average. This difference is then squared, summed, and divided by the number of periods to obtain the variance. Finally, the Standard Deviation is obtained by taking the square root of the variance.
The formula for calculating the standard deviation is as follows:
SD = sqrt [ Σ ( xi – μ )^2 / N ]
where xi is the ith observation, μ is the mean or average value, N is the total number of observations, and Σ is the summation operator.
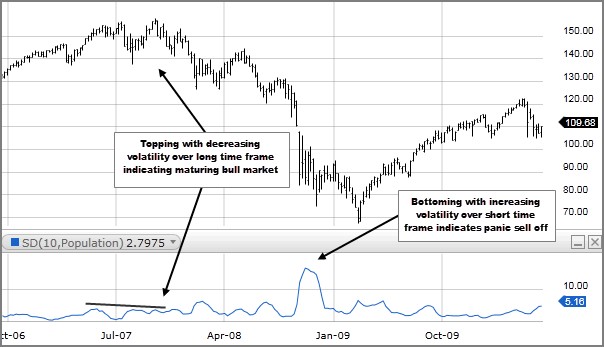
The standard deviation is a useful indicator because it provides information about the spread of the data around the mean. If the SD is low, it indicates that the data is closely clustered around the mean, while a high SD means that the data points are spread out over a wider range of values.
For example, if the average monthly return of a stock is 2%, and the standard deviation is 1%, then we can expect that in most months, the stock’s return will be between 1% and 3%, as 68% of the data falls within one standard deviation of the mean. Similarly, we can say that 95% of the data falls within two standard deviations of the mean, which would be between 0% and 4% in this case.
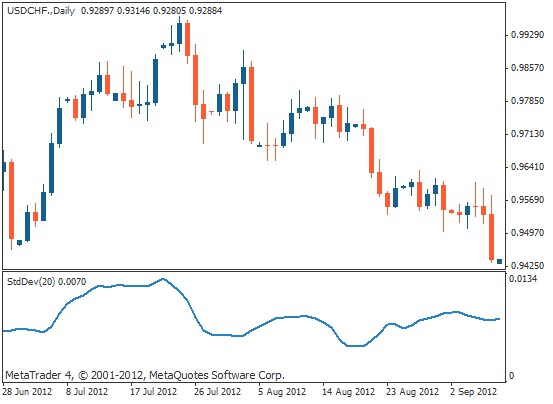
There is no single “best” setting for the standard deviation indicator, as the appropriate settings will depend on the specific application and the characteristics of the data being analyzed. In general, shorter time periods (e.g., 10 or 20 days) are used for intraday trading, while longer time periods (e.g., 50 or 100 days) are used for longer-term analysis.
The standard deviation can be used in conjunction with other technical indicators to provide a more complete picture of market conditions. For example, it is commonly used with moving averages to create Bollinger Bands, which are a popular tool for identifying overbought and oversold conditions in the market.
Examples of how traders and investors use SD:
Traders and investors use the standard deviation in various ways to make trading decisions. For example, if a stock’s price has a high standard deviation, it may be considered more risky or volatile, and therefore may require a wider stop loss or take profit level. On the other hand, if a stock has a low standard deviation, it may be considered less risky, and the trader or investor may be willing to use a tighter stop loss or take profit level.
In summary, the standard deviation is a statistical measure that indicates the amount of variation or dispersion in a set of data points from its mean. It can be used to identify market volatility, establish stop-loss and take-profit levels, and identify overbought and oversold conditions in the market. The appropriate settings for the indicator will depend on the specific application and the characteristics of the data being analyzed, and it can be used in conjunction with other technical indicators to provide a more complete picture of market conditions.

Leave a comment