Keltner Channels is a technical indicator that is used by traders and investors to identify potential price breakouts, trend changes and volatility in the market. The indicator is named after Chester Keltner, who introduced it in his 1960 book, “How to Make Money in Commodities.”
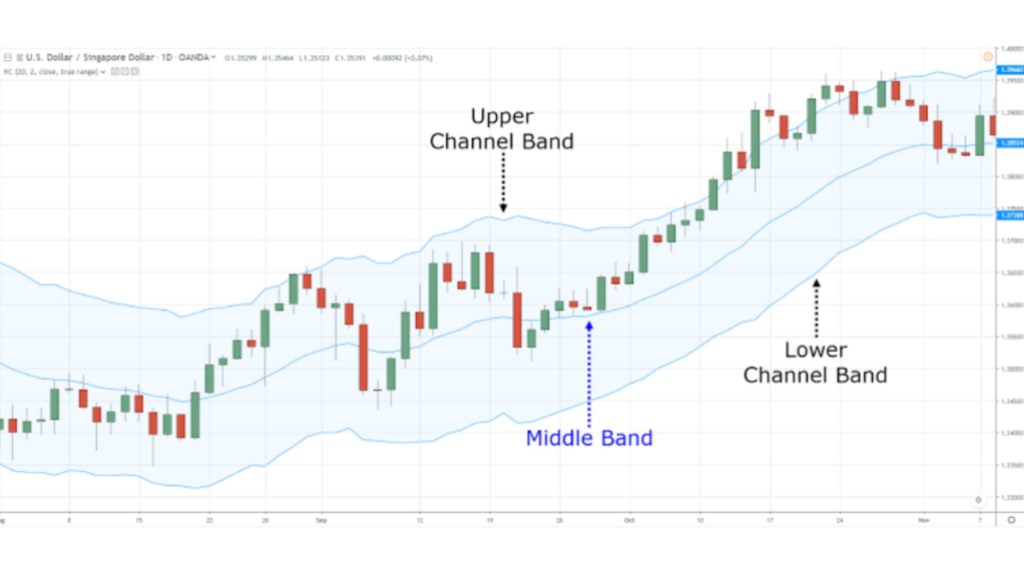
Keltner Channels are plotted using three lines: a middle line that is typically a 20-period exponential moving average (EMA), an upper band that is drawn by adding an offset value (typically 2x the average true range or ATR) to the middle line, and a lower band that is drawn by subtracting the offset value from the middle line.
Traders use the Keltner Channels to identify price movements that are outside the normal range of volatility. When the price is trading near the upper band, it suggests that the security is overbought, and when it is trading near the lower band, it suggests that the security is oversold.

Traders also look for the width of the Keltner Channels to determine the volatility of the market. When the width is narrow, it indicates low volatility, and when it is wide, it indicates high volatility.
The optimal settings for the Keltner Channels depend on the trading style and the security being analyzed. However, a common setting for the middle line is the 20-period EMA, and the offset value is typically 2x the ATR.
Traders often use Keltner Channels in conjunction with other technical indicators to confirm trading signals. For example, a trader may use the Relative Strength Index (RSI) to identify overbought or oversold conditions, and then use the Keltner Channels to confirm potential trend reversals.
Here are two examples of how traders and investors use the Keltner Channels:
Breakout strategy: Traders use Keltner Channels to identify potential breakouts. When the price moves outside the upper or lower band, it suggests that the security is experiencing a breakout. Traders can enter a long or short position depending on the direction of the breakout.
Trend following: Investors use Keltner Channels to identify the direction of the trend. When the price is consistently trading above the middle line and the upper band, it suggests that the security is in an uptrend. Conversely, when the price is consistently trading below the middle line and the lower band, it suggests that the security is in a downtrend.
In summary, Keltner Channels are a technical indicator that is used by traders and investors to identify potential price breakouts, trend changes, and volatility in the market. The indicator is named after Chester Keltner, who introduced it in his 1960 book. The optimal settings for the Keltner Channels depend on the trading style and the security being analyzed. Traders often use Keltner Channels in conjunction with other technical indicators to confirm trading signals.

Leave a comment