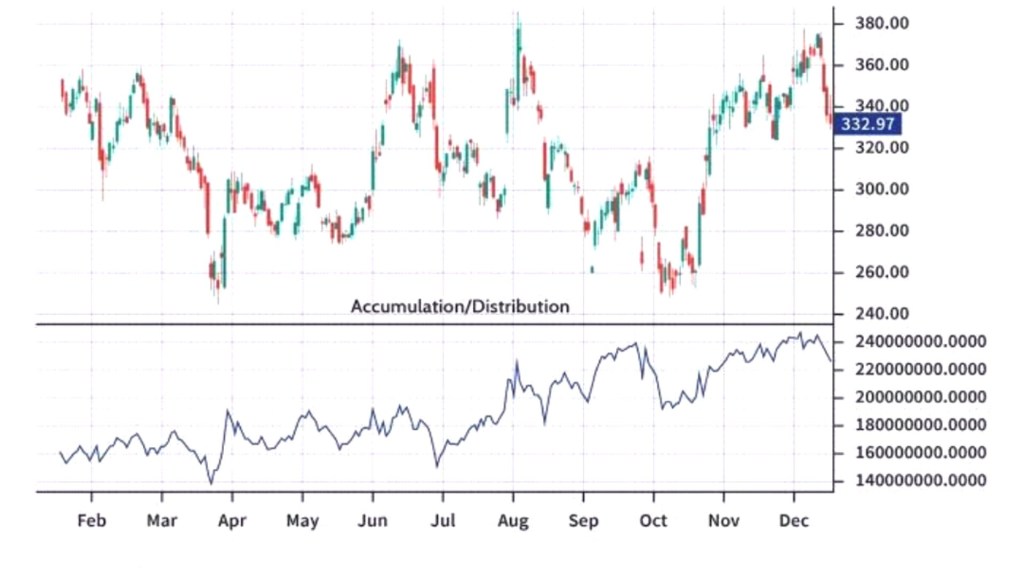
The Accumulation/Distribution Line (A/D Line) is a technical indicator used by traders and investors to analyze the flow of money into or out of a security. The A/D Line indicator was developed by Marc Chaikin and is based on the idea that volume precedes price movement.
The A/D Line measures the amount of buying and selling pressure in a security by considering both the price and volume of trades. The formula for the A/D Line is:
A/D Line = [(Close – Low) – (High – Close)] x Volume / (High – Low)
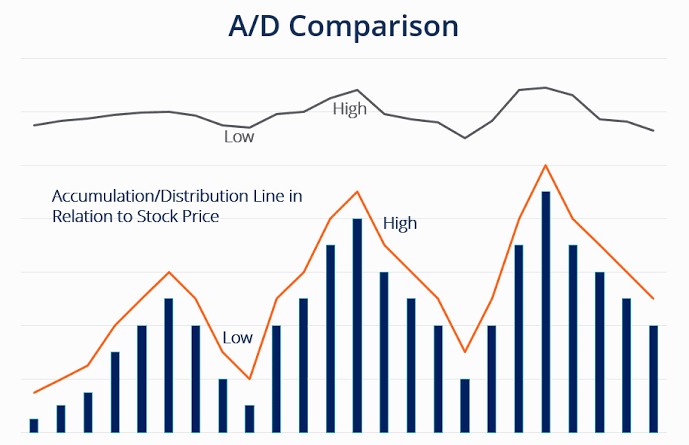
To interpret the A/D Line, traders look for divergences between the indicator and the price of the security. For example, if the A/D Line is trending upward but the price of the security is trending downward, this could be a signal that the security is oversold and due for a reversal. Conversely, if the A/D Line is trending downward while the price of the security is trending upward, this could indicate that the security is overbought and due for a correction.
As for the best settings for the indicator, there is no one-size-fits-all answer. Traders should experiment with different settings and time frames to find what works best for their trading style and the security they are analyzing.
The A/D Line can be used in conjunction with other indicators to confirm buy or sell signals. For example, if the A/D Line is trending upward and the Relative Strength Index (RSI) is also showing bullish divergence, this could provide a stronger signal to buy the security.
Here are two examples of how the A/D Line can be used by traders and investors:
1) Trend confirmation: A trader notices that the price of a security is trending upward, but they want to confirm that the trend is supported by buying pressure. They look at the A/D Line and see that it is also trending upward, which confirms that buyers are driving the price higher. The trader decides to enter a long position based on this information.
2) Divergence: An investor owns shares in a security that have been trending downward. They look at the A/D Line and notice that it has been trending upward, which indicates that buying pressure has been increasing. This divergence between the A/D Line and the price of the security could suggest that the security is oversold and due for a reversal, so the investor decides to hold onto their shares rather than selling at a loss.
In summary, the Accumulation/Distribution Line (A/D Line) is a technical indicator that measures buying and selling pressure in a security. Traders and investors can use the A/D Line to confirm trends and identify potential reversals. The best settings for the indicator will depend on the trader’s style and the security being analyzed. The A/D Line can be used in conjunction with other indicators to provide stronger buy or sell signals.

Leave a comment