The Average True Range (ATR) is a technical analysis indicator used to measure the volatility of an asset. Developed by J. Welles Wilder, ATR is a moving average of the true range over a certain period of time.
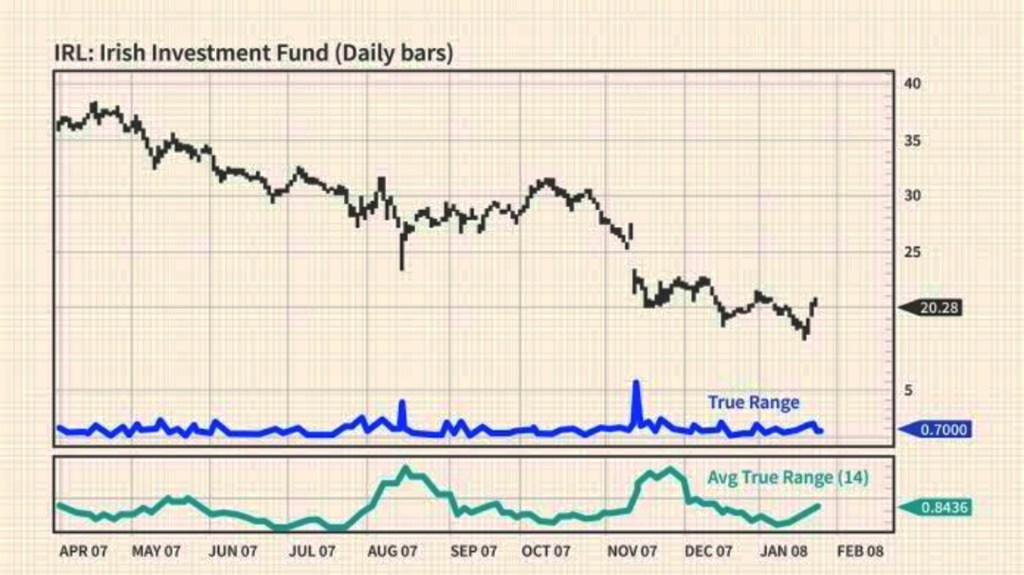
The true range is the largest of the following three values: the distance between the high and low of the current period, the distance between the previous close and the current high and the distance between the previous close and the current low.
ATR is usually calculated using a 14-day period, which means that it calculates the average true range of the past 14 days. However, the period can be adjusted based on the trader’s preference.
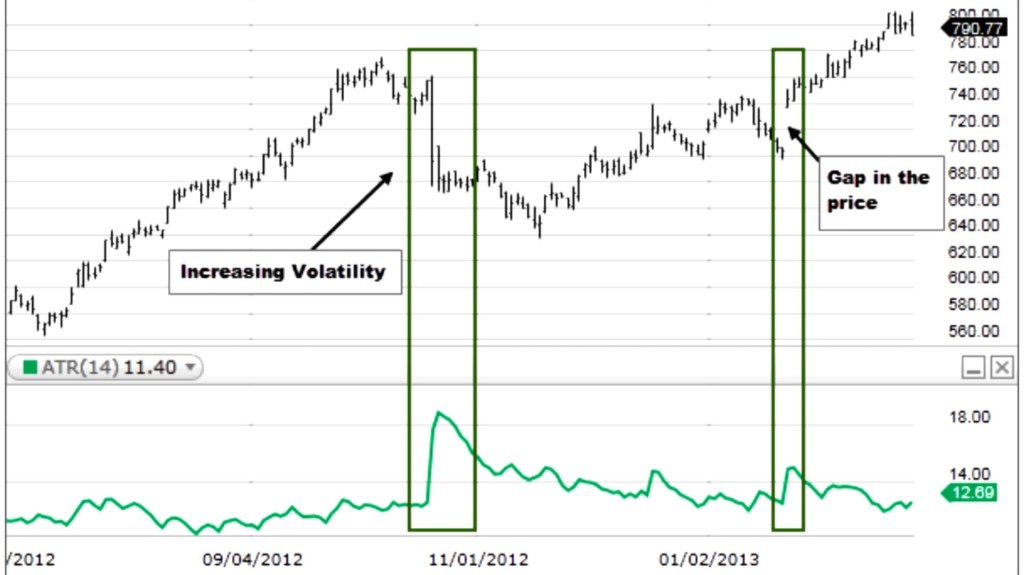
The ATR indicator is plotted as a line on the chart, with higher values indicating higher volatility and lower values indicating lower volatility.
There is no one “best” setting for the ATR indicator, as it depends on the trader’s goals and the asset being analyzed. However, a 14-day period is a good starting point for most traders.
Traders can use the ATR indicator in conjunction with other indicators to identify potential trading opportunities. For example, ATR can be used in combination with a moving average to identify potential breakouts. When the ATR line crosses above the moving average line, it may indicate an increase in volatility and potential breakout.
Another example is using ATR as a trailing stop-loss. Traders can set their stop-loss orders based on a multiple of the ATR value, which adjusts to changes in volatility. This approach can help traders to limit their losses while allowing for potential gains.
Investors can also use the ATR indicator to identify potential entry and exit points for longer-term investments. For example, a long-term investor might wait for the ATR value to drop below a certain level before buying an asset, indicating that volatility has decreased and the asset is less risky. Similarly, the investor might sell the asset when the ATR value reaches a certain level, indicating that volatility has increased and the asset is becoming more risky.
In summary, the Average True Range (ATR) indicator is a technical analysis tool used to measure the volatility of an asset. It is calculated as a moving average of the true range over a certain period of time, and is plotted as a line on the chart. ATR can be used in conjunction with other indicators to identify potential trading opportunities, and can also be used by investors to identify potential entry and exit points for longer-term investments. The best settings for the ATR indicator depend on the trader’s goals and the asset being analyzed.

Leave a comment