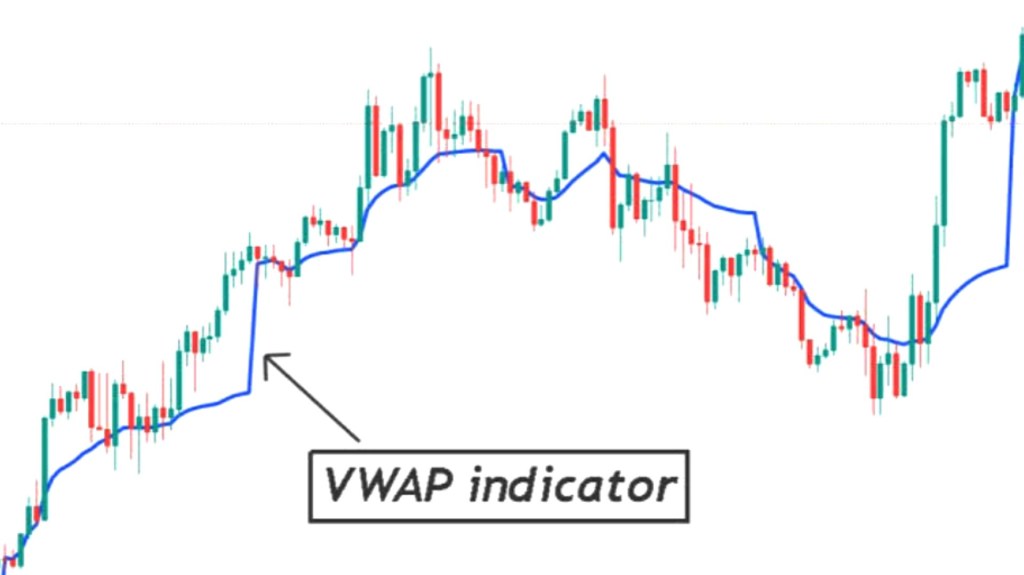
Volume Weighted Average Price (VWAP) is a technical analysis indicator used by traders and investors to identify the average price at which a security has traded throughout the day, taking into account both the price and volume of trades. VWAP is calculated by multiplying the price of each trade by its corresponding volume, adding up the total, and then dividing by the total volume traded.
For example, let’s say that a stock traded at ₹10 for 100 shares, then at ₹12 for 50 shares, and finally at ₹14 for 200 shares. The VWAP for this stock would be calculated as follows:
VWAP = [(10 * 100) + (12 * 50) + (14 * 200)] / (100 + 50 + 200)
= (1000 + 600 + 2800) / 350
= 12
So the VWAP for this stock is ₹12. This means that if the price of the stock is above the VWAP, it is considered bullish, and if it is below the VWAP, it is considered bearish.

Traders and investors use the VWAP indicator to determine whether the current price of a security is overvalued or undervalued relative to the average price for the day. They can use this information to make trading decisions, such as buying when the price is below VWAP and selling when it is above VWAP.
The best settings for the VWAP indicator depend on the time frame being analyzed. For example, a trader may use a 10-day VWAP to analyze a stock over a period of 2 weeks, while a longer-term investor may use a 50-day VWAP to analyze a stock over a period of several months. Additionally, some traders may use different time frames for different securities, depending on their trading strategy and investment goals.
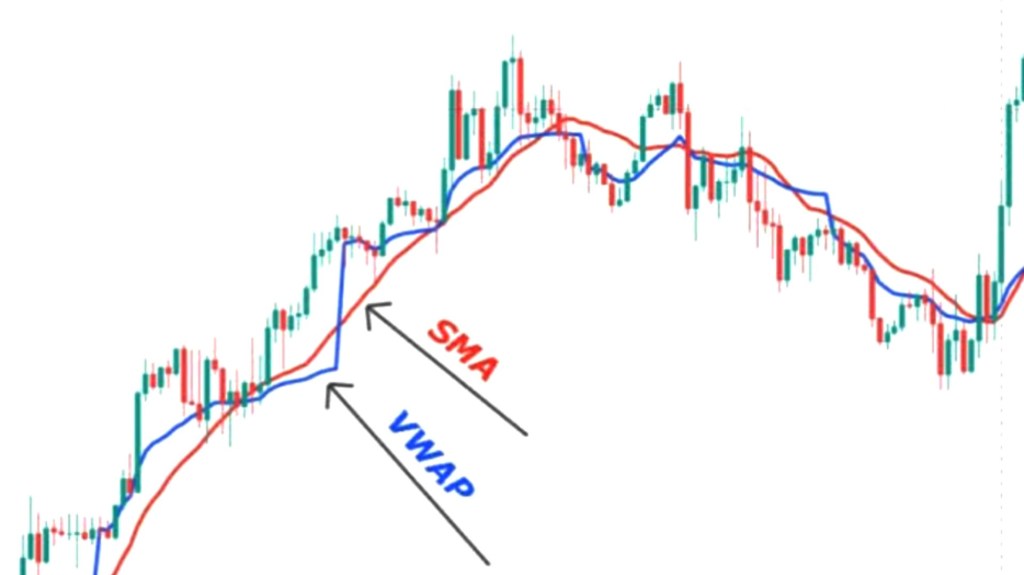
VWAP is often used in conjunction with other indicators, such as moving averages and Bollinger Bands, to confirm trend direction and identify potential entry and exit points. For example, if the price is above the VWAP and the VWAP is sloping upwards, it may indicate a bullish trend. On the other hand, if the price is below the VWAP and the VWAP is sloping downwards, it may indicate a bearish trend. Traders may use other indicators, such as the Relative Strength Index (RSI) or the Moving Average Convergence Divergence (MACD), to confirm these trends and identify potential entry and exit points.
In summary, the VWAP indicator is a useful tool for traders and investors to determine the average price at which a security has traded throughout the day. It can be used to identify whether a stock is overvalued or undervalued, and to make trading decisions based on this information. The best settings for the indicator depend on the time frame being analyzed and the trader’s or investor’s strategy.

Leave a comment