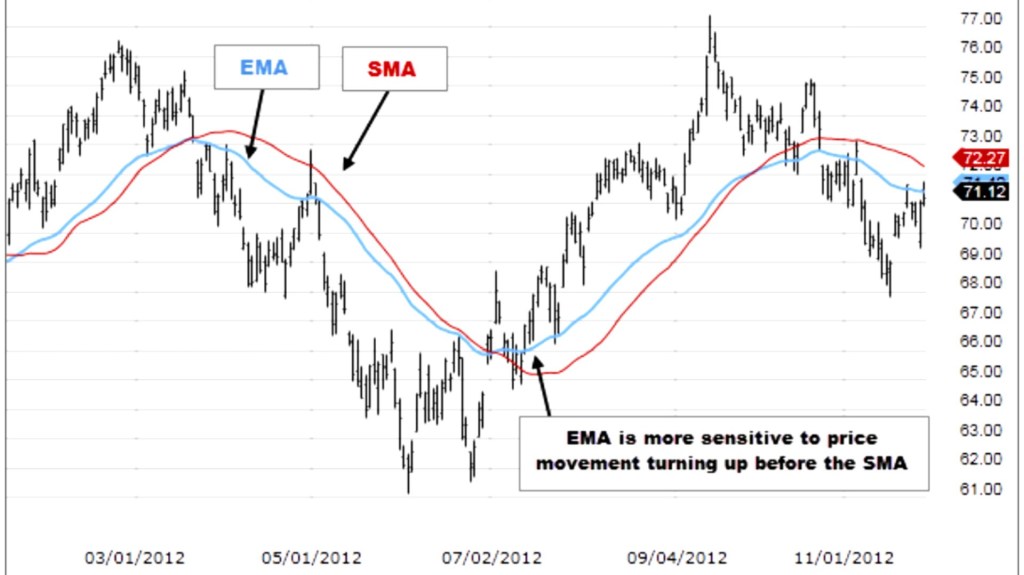
The Exponential Moving Average (EMA) is a technical indicator used to identify trends in stock prices or other financial instruments. It is similar to the Simple Moving Average (SMA), but it gives more weight to recent price data points, making it more responsive to short-term price movements.
The EMA is calculated by taking the average of a given number of periods of price data, with more recent periods weighted more heavily. The formula for calculating EMA is as follows:
EMA = (Price(t) x Multiplier) + EMA(y) x (1 – Multiplier)
Where:
Price(t) is the current closing price of the asset being tracked
EMA(y) is the previous EMA value
Multiplier = 2 / (n+1), where n is the number of periods used in the calculation.
For example, let’s say we want to calculate the 10-day EMA for a stock. We would take the closing prices of the last 10 days, and apply the above formula to get the EMA value for day 10. We would then repeat this process for each subsequent day, using the previous day’s EMA value as the EMA(y) input in the formula.
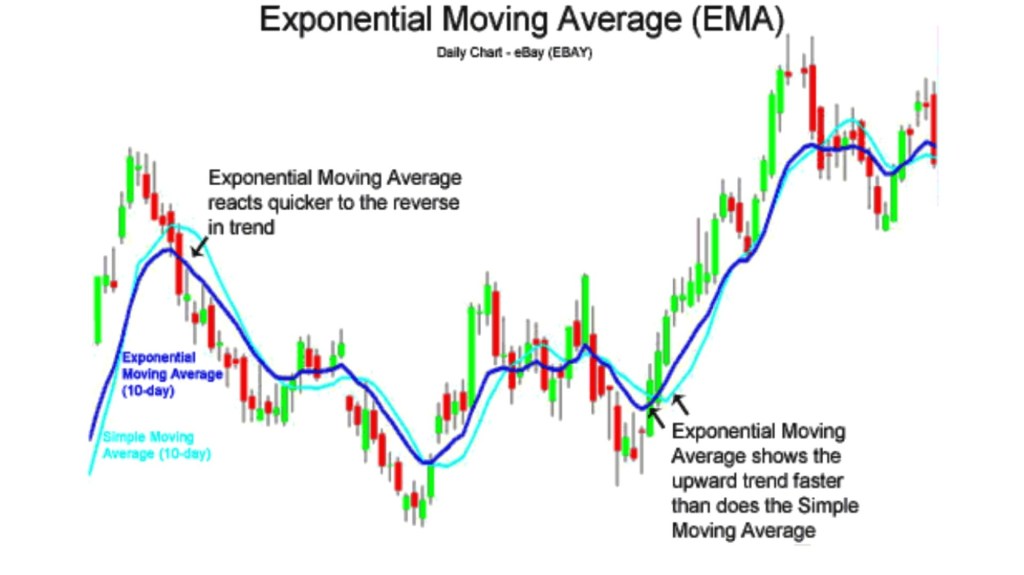
The best settings for the EMA indicator depend on the trader’s individual preferences and trading style. Some traders use shorter time frames, such as a 10-day EMA, for more responsive signals, while others prefer longer time frames, such as a 50-day or 200-day EMA, for more stable signals.
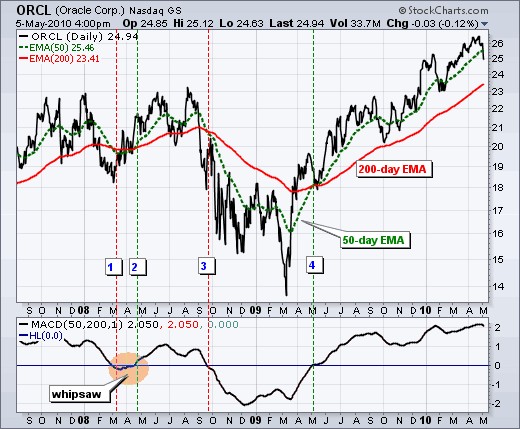
The EMA is often used in combination with other technical indicators, such as the Relative Strength Index (RSI) or Moving Average Convergence Divergence (MACD), to confirm trading signals. Three examples of how the EMA is used by different categories of traders are:
Trend-following traders: These traders use the EMA to identify trends in stock prices and enter trades in the direction of the trend. They may use a combination of short-term and long-term EMAs, such as a 10-day and 50-day EMA, to confirm the trend direction.
Momentum traders: These traders use the EMA to identify changes in momentum in stock prices. They may look for crossovers between the price and a short-term EMA, such as a 10-day EMA, as a signal to enter a trade in the direction of the momentum.
Swing traders: These traders use the EMA to identify potential support and resistance levels in stock prices. They may look for bounces off a longer-term EMA, such as a 50-day or 200-day EMA, as a signal to enter a trade in the direction of the trend.
Range traders: These traders use the EMA to identify price levels where the asset is likely to trade within a range. They may use a combination of short-term and long-term EMAs, such as a 10-day and 50-day EMA, to identify key support and resistance levels. When the asset reaches one of these levels, the range trader may enter a trade in the opposite direction, expecting the asset to revert to the mean.
Position traders: These traders use the EMA to identify long-term trends in stock prices and enter trades that they expect to hold for several months or even years. They may use a long-term EMA, such as a 200-day EMA, to identify the overall trend direction and use shorter-term EMAs, such as a 50-day or 20-day EMA, to identify potential entry and exit points. Position traders are less concerned with short-term price movements and are focused on capturing the long-term trend.
In summary, the Exponential Moving Average (EMA) is a technical indicator used to identify trends in stock prices or other financial instruments. It is similar to the Simple Moving Average (SMA), but it gives more weight to recent price data points, making it more responsive to short-term price movements. The best settings for the EMA indicator depend on the trader’s individual preferences and trading style, and it is often used in combination with other technical indicators, such as the Relative Strength Index (RSI) or Moving Average Convergence Divergence (MACD), to confirm trading signals. Different categories of traders, such as trend-following traders, momentum traders, swing traders, range traders, and position traders, use the EMA in different ways to make trading decisions.

Leave a comment