The Chaikin Oscillator is a technical analysis indicator that is used to measure the momentum of a security or an index. It was created by Marc Chaikin, an American stockbroker, and it is based on the Accumulation Distribution Line (ADL) indicator. The Chaikin Oscillator helps traders and investors to identify potential trend reversals and to confirm the strength of a trend.
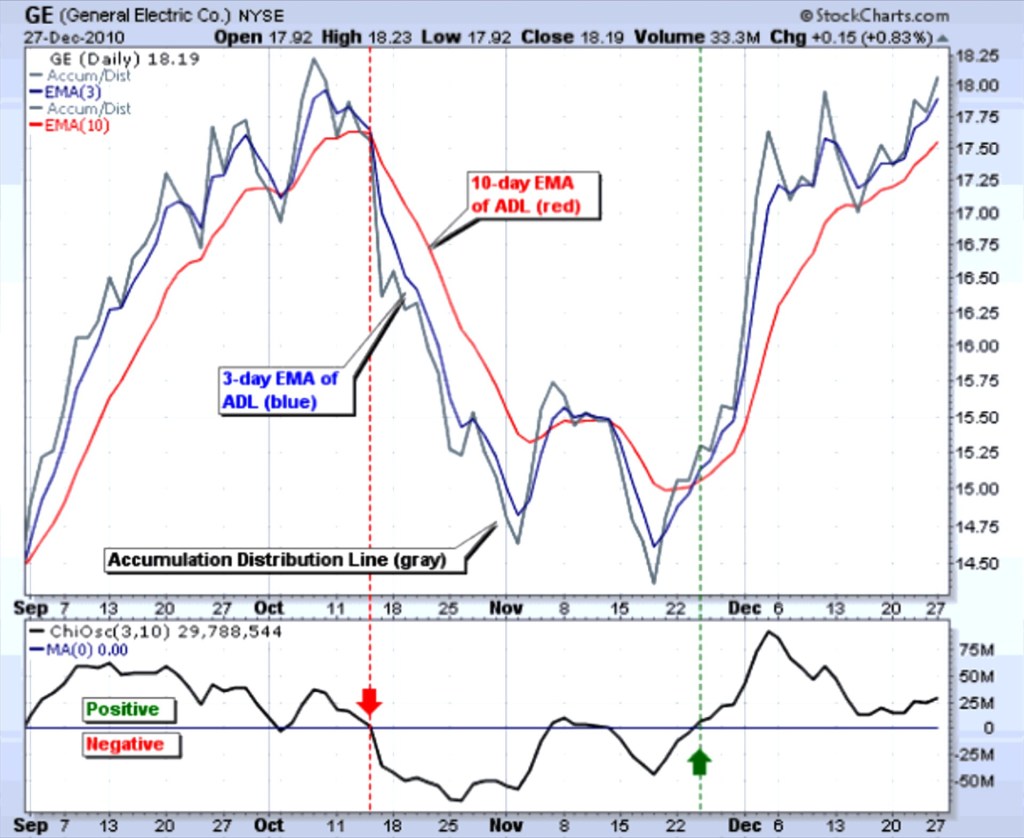
The Chaikin Oscillator is calculated by subtracting a 10-period exponential moving average (EMA) of the ADL from a 3-period EMA of the ADL. The ADL is calculated by taking the sum of the volume for each period multiplied by the difference between the closing price and the midpoint of the high and low price for that period. The result is added to the previous ADL value to create a cumulative total.
To explain this more simply, the Chaikin Oscillator looks at the buying and selling pressure for a security based on its price and volume data. The indicator then plots the difference between the 3-period and 10-period EMAs of the ADL as a line chart, with values above the zero line indicating bullish momentum and values below the zero line indicating bearish momentum.
Here is an example of the Chaikin Oscillator applied to the S&P 500 index:
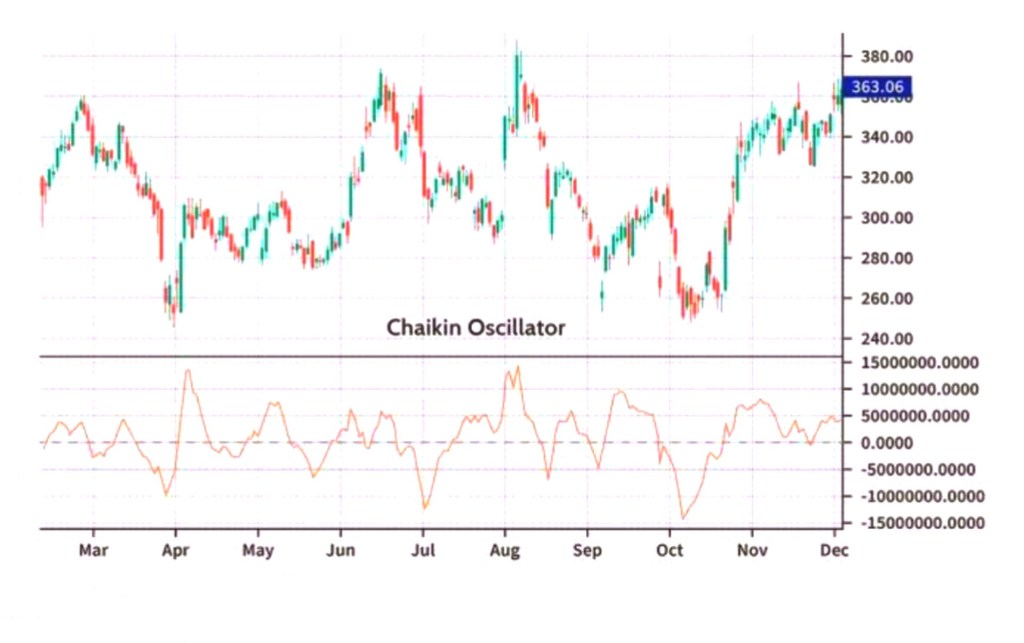
In the chart above, the red line represents the Chaikin Oscillator. As you can see, the oscillator fluctuates above and below the zero line, indicating changes in momentum. Traders and investors use the oscillator to identify potential trend reversals, confirm the strength of a trend, and to generate buy and sell signals.
The best settings for the Chaikin Oscillator may vary depending on the security being analyzed and the timeframe being used. Some traders prefer to use a longer-term oscillator with a 20-period EMA of the ADL and a 10-period EMA of the ADL. Others prefer to use a shorter-term oscillator with a 3-period EMA of the ADL and a 10-period EMA of the ADL. Ultimately, the best settings will depend on the trader’s personal preference and their trading style.
Traders and investors use the Chaikin Oscillator in a variety of ways. Some use it as a standalone indicator to generate buy and sell signals. For example, when the oscillator crosses above the zero line, it is considered a bullish signal, while a crossover below the zero line is considered bearish. Others use the oscillator in conjunction with other indicators, such as moving averages or trendlines, to confirm the strength of a trend or to identify potential trend reversals.
To sum up, the Chaikin Oscillator can be a useful tool for traders and investors looking to analyze momentum and identify potential trading opportunities. However, it should be used in conjunction with other technical analysis tools and should not be relied upon as the sole basis for making trading decisions.

Leave a comment