On-Balance Volume (OBV) is a technical analysis indicator that measures buying and selling pressure by adding or subtracting the total volume traded in a market based on price movements. The OBV indicator was developed by Joseph Granville in the 1960s and has been widely used by traders and investors to identify trends and confirm price movements.
The OBV indicator is based on the principle that volume precedes price, which means that changes in volume can signal a change in the direction of price. When prices are rising, buying pressure is said to be in control, and when prices are falling, selling pressure is said to be in control.
The OBV indicator works by summing the volume of all trades on days when the price closes higher than the previous day’s close and subtracting the volume of all trades on days when the price closes lower than the previous day’s close. The result is then added to the previous day’s OBV value to get the current OBV value.
For example, suppose the OBV value on Monday was 100, and the price closed higher on Tuesday with a volume of 50. The OBV value on Tuesday would be 150, which is the sum of the previous day’s OBV value (100) and the volume on Tuesday (50). If the price closed lower on Wednesday with a volume of 30, the OBV value on Wednesday would be 120, which is the previous day’s OBV value (150) minus the volume on Wednesday (30).
The best settings for the OBV indicator depend on the market being analyzed and the time frame being used. Some traders use a shorter-term OBV, such as a 14-day OBV, to identify short-term trends, while others use a longer-term OBV, such as a 200-day OBV, to identify long-term trends.
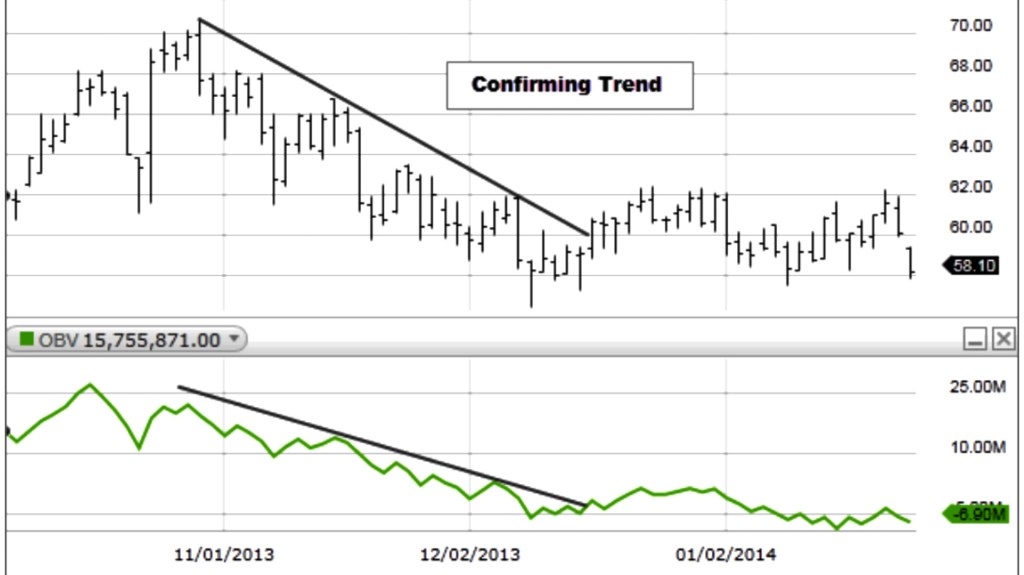
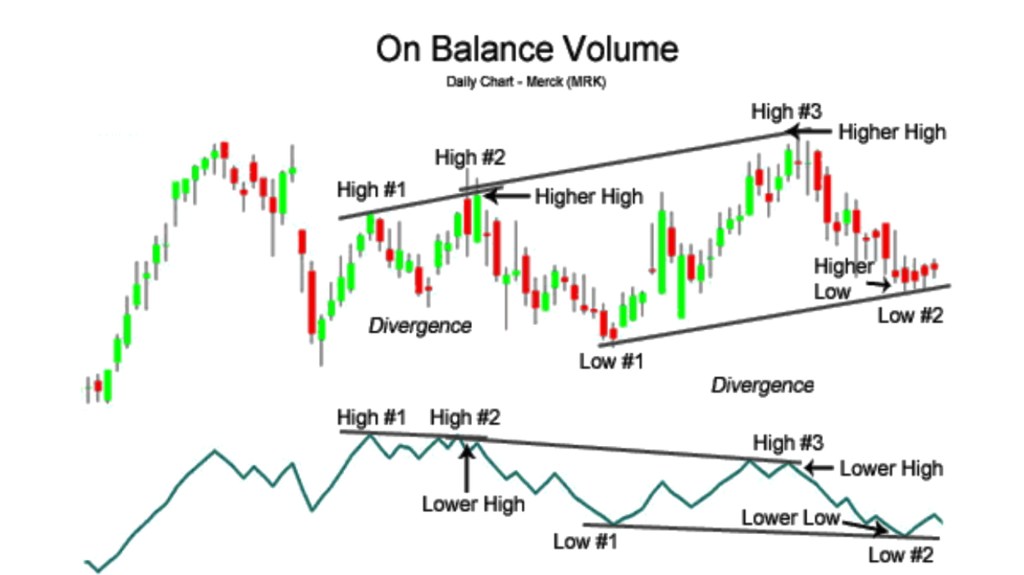
Traders and investors use the OBV indicator to confirm price trends and identify potential trend reversals. When the OBV indicator is rising along with prices, it is said to confirm the uptrend, and when the OBV indicator is falling along with prices, it is said to confirm the downtrend. If prices are rising, but the OBV indicator is falling, it may signal that buying pressure is weakening and a trend reversal may be imminent. Conversely, if prices are falling, but the OBV indicator is rising, it may signal that selling pressure is weakening and a trend reversal may be imminent.
To conclude, the OBV indicator can be a useful tool for traders and investors to confirm price trends and identify potential trend reversals. However, like all technical analysis indicators, it should not be used in isolation and should be used in conjunction with other indicators and analysis techniques.

Leave a comment