The Ichimoku Cloud is a technical indicator used to analyze financial markets. It was developed by a Japanese journalist named Goichi Hosoda in the late 1930s. The indicator is based on multiple moving averages and is designed to provide a comprehensive view of price action, trend direction, support and resistance levels, and momentum. The name “Ichimoku” translates to “one glance,” highlighting its ability to provide a holistic view of market conditions.
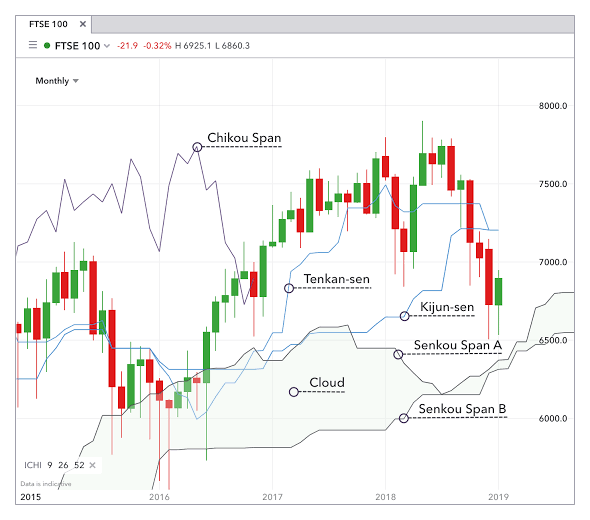
The Ichimoku Cloud is composed of five lines:
Tenkan-Sen (Conversion Line): It is the shorter-term moving average and is calculated as the average of the highest high and lowest low over the past nine periods.
Kijun-Sen (Base Line): It is the longer-term moving average and is calculated as the average of the highest high and lowest low over the past 26 periods.
Senkou Span A (Leading Span A): It is the midpoint between the Tenkan-Sen and Kijun-Sen lines, plotted 26 periods ahead.
Senkou Span B (Leading Span B): It is the midpoint of the highest high and lowest low over the past 52 periods, plotted 26 periods ahead.
Chikou Span (Lagging Span): It is the current closing price, plotted 26 periods behind.
The area between Senkou Span A and Senkou Span B forms the “cloud” or “kumo,” which is shaded in green when the price is above the cloud and in red when the price is below the cloud. The thickness of the cloud indicates the strength of support and resistance levels.
Here’s an example of the Ichimoku Cloud on a daily chart of Apple Inc. (AAPL):
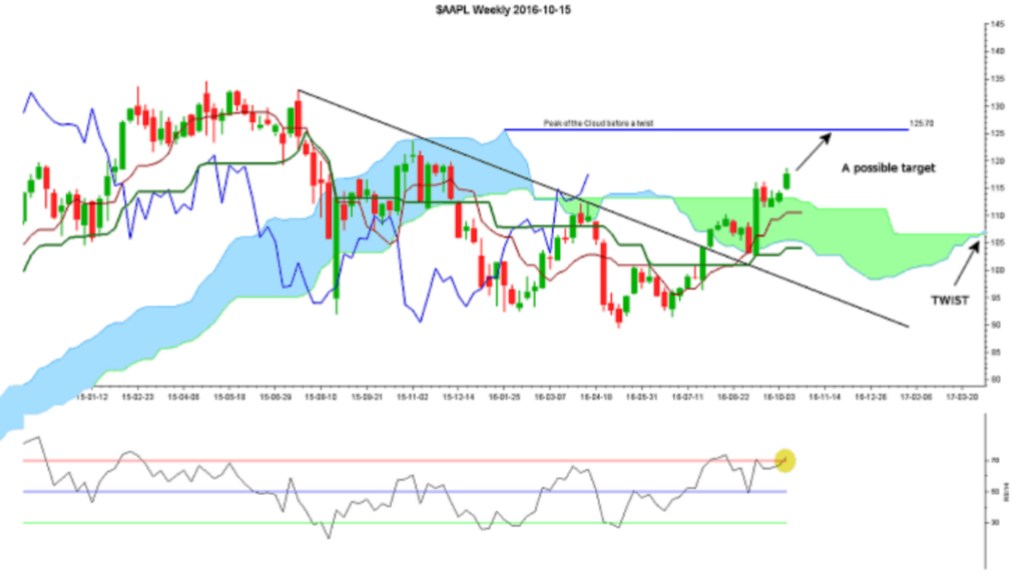
In this example, the green cloud indicates a strong bullish trend while the red cloud indicates a strong bearish trend. The Chikou Span (lagging line) also confirms the bullish trend as it is above the price action. The Tenkan-Sen and Kijun-Sen lines can act as support and resistance levels, while the crossover of these lines can signal a change in trend.
As for the best settings for the Ichimoku Cloud indicator, there is no fixed setting that works best for all markets and timeframes. Traders and investors typically adjust the settings based on their trading style and market conditions. Some common settings include 9, 26, 52 for the Tenkan-Sen, Kijun-Sen, and Senkou Span B lines, respectively.
Traders and investors use the Ichimoku Cloud indicator to identify trends, support and resistance levels, and momentum. Some common trading strategies using the indicator include:
Cloud Breakout: A long position is taken when the price breaks above the cloud, and a short position is taken when the price breaks below the cloud.
Tenkan-Kijun Cross: A long position is taken when the Tenkan-Sen line crosses above the Kijun-Sen line, and a short position is taken when the Tenkan-Sen line crosses below the Kijun-Sen line.
Kumo Twist: A long position is taken when the Senkou Span A line crosses above the Senkou Span B line, and a short position is taken when the Senkou Span A line crosses below the Senkou Span B line.
It’s important to note that no indicator or trading strategy is foolproof and should be used in conjunction with other analysis tools and risk management techniques.

Leave a comment