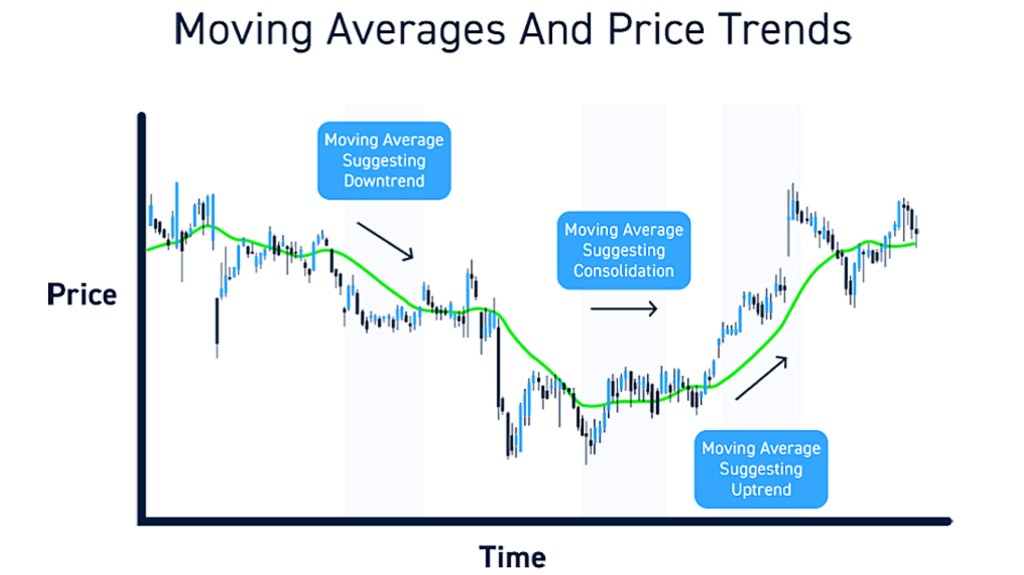
Moving Average (MA) is a technical analysis indicator that helps traders and investors identify trends in the market by smoothing out price fluctuations. It is a simple calculation that is widely used in financial markets to analyze the past and predict future price movements.
To understand Moving Average, let’s start with the definition of an average. An average is a number that represents the sum of a group of numbers divided by the total number of numbers. For example, the average of 3, 5, and 7 is (3+5+7)/3 = 5.
Moving Average takes the same concept but instead of taking the average of all the numbers at once, it takes the average of a certain number of periods. For example, a 10-day Moving Average takes the average of the last 10 closing prices of a stock. The average is calculated by adding the closing prices of the last 10 days and then dividing by 10.
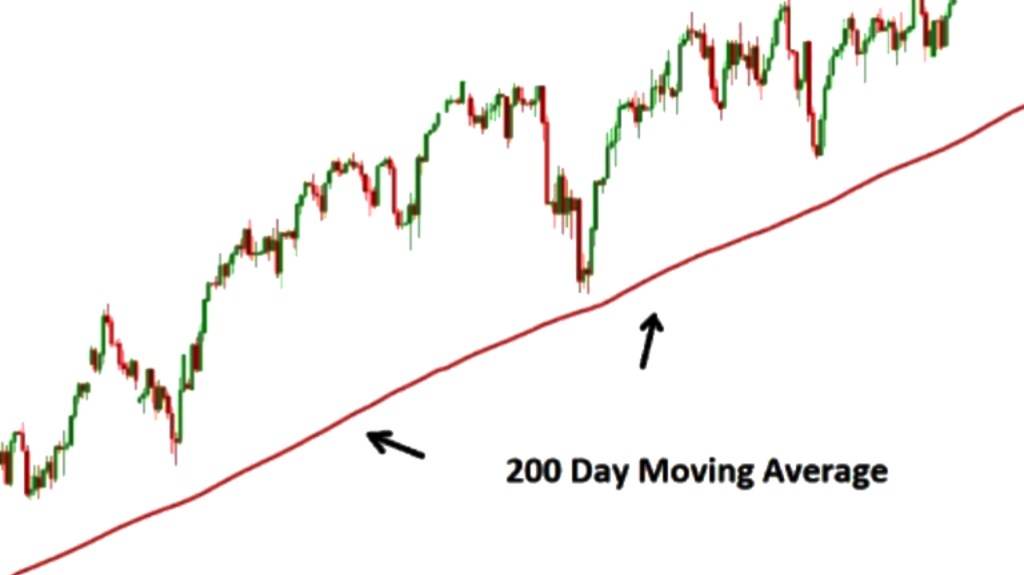
The Moving Average indicator is plotted on a chart as a line that shows the average price of an asset over a specific period. As the name suggests, the line moves as new prices are added and old prices are dropped from the calculation.
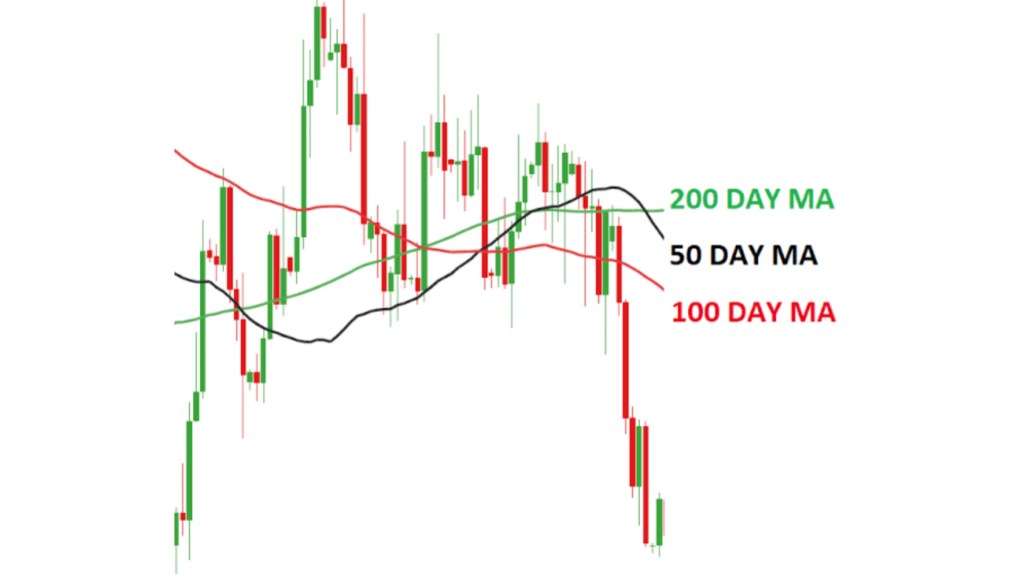
Moving Averages can be calculated for any time period, but the most commonly used periods are 50-day, 100-day, and 200-day Moving Averages. The longer the time period, the smoother the Moving Average line becomes, but it also lags behind the current price movement.
Here’s an example of how Moving Average works:
Suppose a trader wants to analyze the stock of ABC company, which has been trading at the following prices over the past 5 days:
Day 1: ₹20
Day 2: ₹22
Day 3: ₹23
Day 4: ₹21
Day 5: ₹24
To calculate a 3-day Moving Average, the trader would take the average of the last three closing prices:
Day 3 Moving Average = (20 + 22 + 23)/3 = ₹21.67
Similarly, the Moving Averages for Day 4 and Day 5 would be:
Day 4 Moving Average = (22 + 23 + 21)/3 = ₹22
Day 5 Moving Average = (23 + 21 + 24)/3 = ₹22.67
The Moving Average line is then plotted on a chart as a line that shows the average price of the stock over the past 3 days.
Moving Averages can be used in correlation with other indicators to confirm or negate trading signals. For example, if the Moving Average line crosses above the stock price, it is considered a bullish signal, and if it crosses below the stock price, it is considered a bearish signal. Traders also use Moving Average crossovers, where a short-term Moving Average (such as 20-day MA) crosses above a long-term Moving Average (such as 50-day MA) as a buy signal and vice versa as a sell signal.
There is no best setting for Moving Averages as it depends on the trader’s preference, trading style, and the asset being analyzed. Traders use a combination of Moving Averages with different periods that works best for them to get a more comprehensive view of the market trends.

Leave a comment