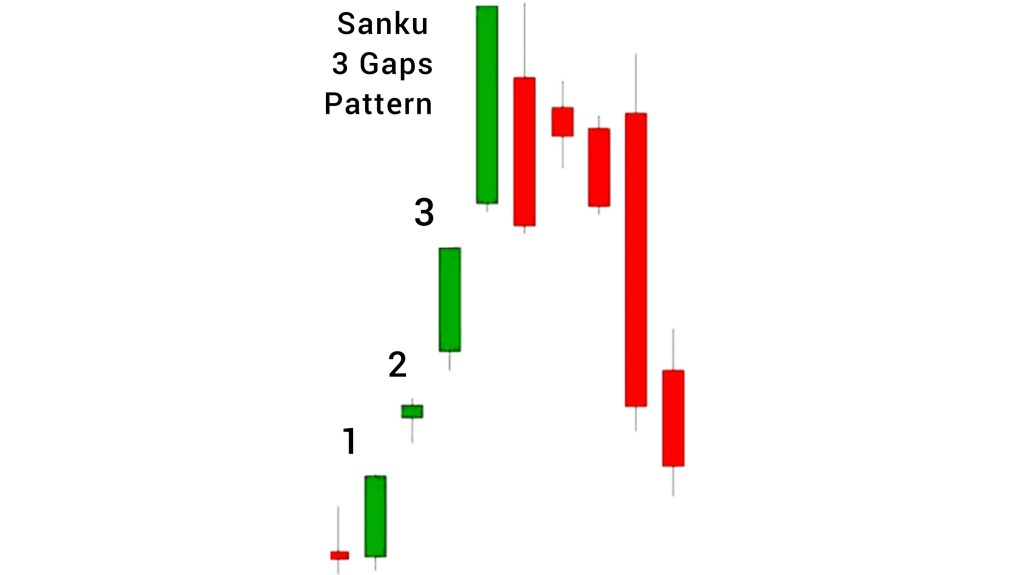
The “Sanku pattern”, also known as the Three Gaps pattern, is a Japanese candlestick charting pattern used in technical analysis to signal a potential trend reversal. The word “Sanku” literally means “three gaps” in Japanese, referring to the three gaps created by the pattern.
The Sanku pattern consists of three candlesticks, with the first candlestick being a long green candlestick in an uptrend, or a long red candlestick in a downtrend. The second candlestick is ideally a relatively smaller candle that gaps up from the first candlestick’s close in an uptrend, or gaps down from the first candlestick’s close in a downtrend. The third candlestick is ideally a long green candlestick in an uptrend, or a long red candlestick in a downtrend, which gaps up from the second candlestick’s open in an uptrend, or gaps down from the second candlestick’s open in a downtrend.
However, the color and size of the candles are not as important as the fact that it has a GAP between it and the previous candlestick. The second and third candlesticks can be either small-bodied or long-bodied, and the size of the candlesticks may provide additional information about the strength of the potential reversal.
The candles—with gaps between them—may be consecutive, but they don’t need to be. There may be several candles, then a gap, and so on. Each of those “candles” could consist of multiple candles, although in fast moving markets it is typically only one or two.
The appearance of the pattern suggests a trend may be nearing exhaustion and traders should be on the lookout for signs of a reversal. For traders, the pattern signals them to trail their stop losses. The Sanku pattern suggests that buyers are losing control of the market in an uptrend or that sellers are losing control in a downtrend, leading to a potential trend reversal. The first candlestick represents the existing trend, while the second candlestick indicates a weakening of the trend, and the third candlestick confirms the reversal.

To confirm the Sanku pattern, traders typically look for the third candlestick to close below the second candlestick’s low in an uptrend or above the second candlestick’s high in a downtrend. Traders may also look for other technical indicators or chart patterns to confirm the reversal.
It’s important to note that like any technical analysis tool, the Sanku pattern is not foolproof, not all Sanku patterns will be followed by a reversal and traders should always use other technical analysis tools and risk management strategies to help minimize potential losses.

Leave a comment