The “matching low” and “matching high” patterns are two examples of candlestick patterns that traders can use to help identify potential market reversals or continuations.
Matching Low Pattern:
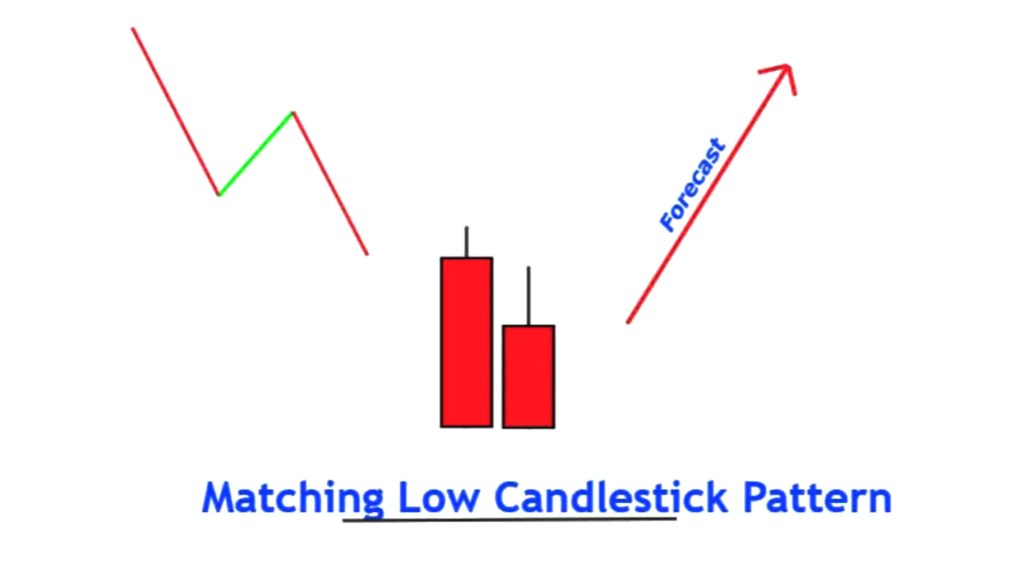
The matching low pattern consists of two candlesticks. The first candlestick is a bearish candle that opens near its high and closes near its low. The second candlestick is a bullish candle that opens near the low of the previous candle and closes near its high. The second candlestick’s body should be roughly the same size as the first candlestick’s body, and the low of the second candlestick should be at or near the same price level as the low of the first candlestick.
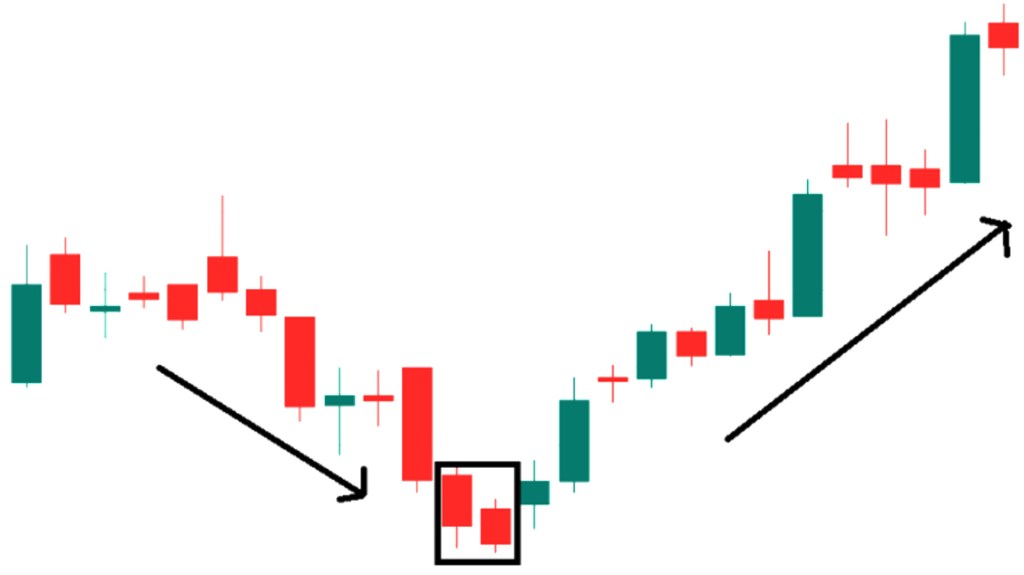
The matching low pattern is significant because it suggests that the selling pressure that caused the first candlestick’s bearish move has been exhausted. The second candlestick’s bullish move shows that buyers have stepped in at the same price level, indicating that there is strong support at that level. Traders may interpret this as a sign that the trend may be about to reverse or that there is a high probability that the price will continue to rise.
Matching High Pattern:

The matching high pattern is the opposite of the matching low pattern and consists of two candlesticks. The first candlestick is a bullish candle that opens near its low and closes near its high. The second candlestick is a bearish candle that opens near the high of the previous candle and closes near its low. The second candlestick’s body should be roughly the same size as the first candlestick’s body, and the high of the second candlestick should be at or near the same price level as the high of the first candlestick.
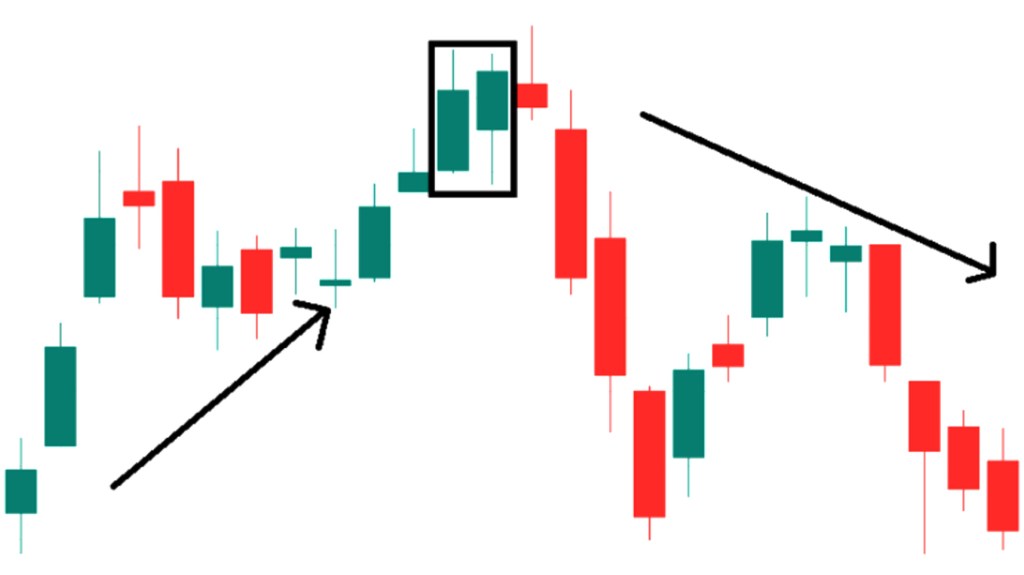
The matching high pattern is significant because it suggests that the buying pressure that caused the first candlestick’s bullish move has been exhausted. The second candlestick’s bearish move shows that sellers have stepped in at the same price level, indicating that there is strong resistance at that level. Traders may interpret this as a sign that the trend may be about to reverse or that there is a high probability that the price will continue to fall.
In both cases, it is essential to confirm the pattern with other technical indicators and analysis before making any trading decisions. Candlestick patterns are not always accurate and should be used in conjunction with other analysis tools to help make informed trading decisions.

Leave a comment