The terms “bullish homing pigeon” and “bearish homing pigeon” are used in technical analysis to describe patterns observed in stock charts. These patterns can indicate a potential shift in market sentiment, and are often used by traders to make trading decisions.
A “homing pigeon” is a pattern where a small body candlestick (i.e., a candlestick with a short range between its opening and closing price) is formed after the formation of a larger body candlestick of similar colour. The large candlestick “engulfs” the small candlestick completely. The homing pigeon pattern can occur in both bullish and bearish markets, and is named after the bird that is known for returning to its home base.
Here’s a breakdown of the two patterns:
Bullish Homing Pigeon
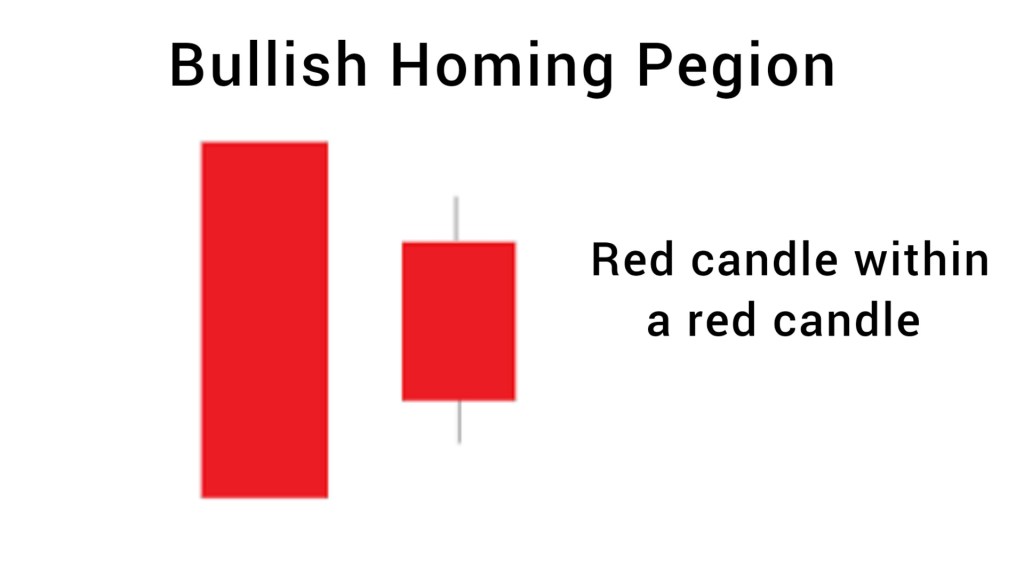
The bullish homing pigeon pattern occurs during a downtrend, and it signals a potential reversal to an uptrend. The pattern consists of a small bearish candlestick formed after a larger bearish candlestick. The large candle completely engulfs the second smaller candlestick’s body, indicating that the closing price was lower than the opening price. This pattern may indicate that there is a weakening of the current downward trend, which increases the likelihood of an upward reversal.
Traders often interpret the bullish homing pigeon as a sign that the selling pressure has been exhausted, and that buyers are starting to enter the market. This can be a signal to buy the stock or take a long position.
Bearish Homing Pigeon
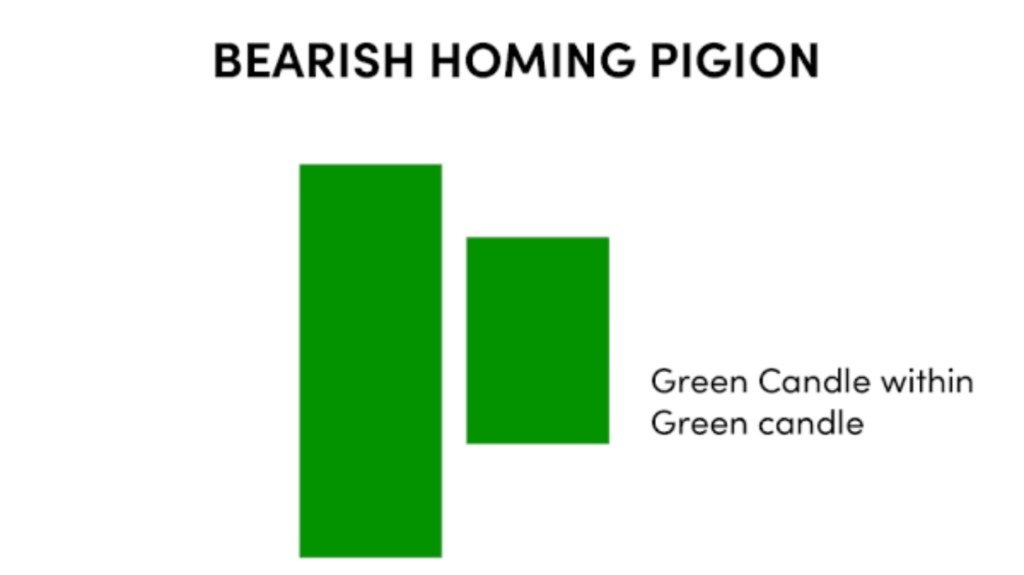
The bearish homing pigeon pattern occurs during an uptrend, and it signals a potential reversal to a downtrend. The pattern consists of a small bullish candlestick formed after a larger bullish candlestick that completely engulfs the smaller candlestick’s body. The bullish candlestick is usually accompanied by high trading volume, which adds to the pattern’s bearishness.This pattern may indicate that there is a weakening of the current upward trend, which increases the likelihood of a reversal.
Traders often interpret the bearish homing pigeon as a sign that the buying pressure has been exhausted, and that sellers are starting to enter the market. This can be a signal to sell the stock or take a short position.
The homing pigeon candlestick pattern is similar to some other candlestick patterns that provides traders with insight into potential market shifts. However, the specific characteristics of the homing pigeon pattern make it unique from other candlestick patterns.
For example, the homing pigeon pattern is relatively similar to the engulfing pattern, where a small body candlestick is completely engulfed by a larger body candlestick. However, the difference between the two patterns is the position of the smaller candlestick within the larger candlestick’s range. In the homing pigeon pattern, the smaller candlestick is completely engulfed within the range of the larger candlestick of similar colour, while in the engulfing pattern, the smaller candlestick can be located anywhere within the range of the larger candlestick.
Similarly, the homing pigeon pattern can be quite similar to the harami pattern, where a smaller candlestick is formed after a larger candlestick that engulfs it. However, the difference is that in the harami pattern, the smaller candlestick is located within the range of the larger candlestick, but it doesn’t necessarily need to be completely engulfed by it.
In summary, while the homing pigeon pattern shares similarities with other candlestick patterns, its specific characteristics make it a unique pattern that traders can use to make trading decisions. As with any candlestick pattern, traders should confirm the pattern with other technical indicators and fundamental analysis before making a trade as these patterns can be helpful in making trading decisions, they are not foolproof indicators.

Leave a comment