
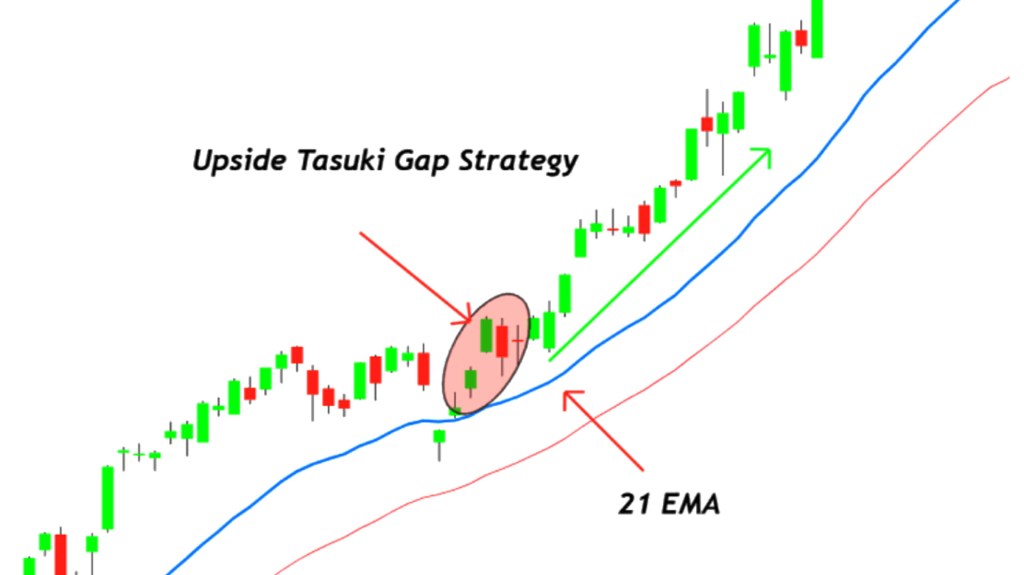
The “Upside Tasuki Gap” is a bullish candlestick pattern that occurs during an uptrend and is formed by a gap between two candlesticks. It is a continuation pattern, meaning that it signals a continuation of the prevailing uptrend.
Here are the characteristics of the Upside Tasuki Gap pattern:
a) The market should be in an uptrend.
b) The first candlestick should be a long green candlestick.
c) The second candlestick should open higher than the previous day’s close, leaving a gap.
d) The second candlestick should be a red or green candlestick, but the color is not as important as the gap.
e) The third candlestick should open within the gap created by the first two candlesticks and should close above the midpoint of the first candlestick.
The interpretation of this pattern is that the market is taking a short break before continuing its uptrend. The second candlestick represents a brief period of profit-taking or consolidation, but the bullish sentiment remains strong. The third candlestick indicates that the bulls have regained control of the market, and the uptrend is likely to continue.
Traders can use this pattern to identify potential buying opportunities during an uptrend. They can enter a long position when the third candlestick closes above the midpoint of the first candlestick, with a stop loss below the low of the second candlestick. Profit targets can be set based on previous price levels or using a trailing stop loss.
It is worth noting that no pattern or indicator is 100% accurate, and traders should use other technical analysis tools and risk management strategies to make informed trading decisions.

Leave a comment