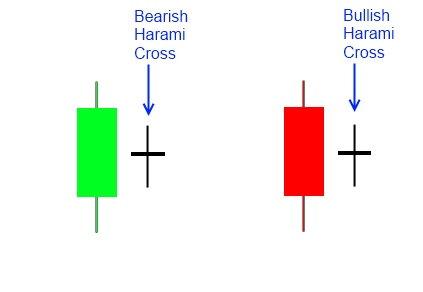
The “Harami Cross” is a candlestick pattern in technical analysis that signals a potential trend reversal. It is formed by two candles, with the first candle being a long candle in the direction of the trend, followed by a small candle with a long shadow, which represents indecision in the market.
Here are the characteristics of the Harami Cross pattern:
1) The first candle is a long bullish or bearish candle that confirms the current trend.
2) The second candle is a small doji candle with a long upper and/or lower shadow. The open and close prices of the second candle are usually within the range of the previous candle.
3) The second candle should have an opposite color to the first candle, indicating a potential reversal.
The Harami Cross pattern can be either bullish or bearish, depending on the direction of the previous trend. A bullish Harami Cross pattern is formed when the first candle is bearish and the second candle is bullish. Conversely, a bearish Harami Cross pattern is formed when the first candle is bullish and the second candle is bearish.
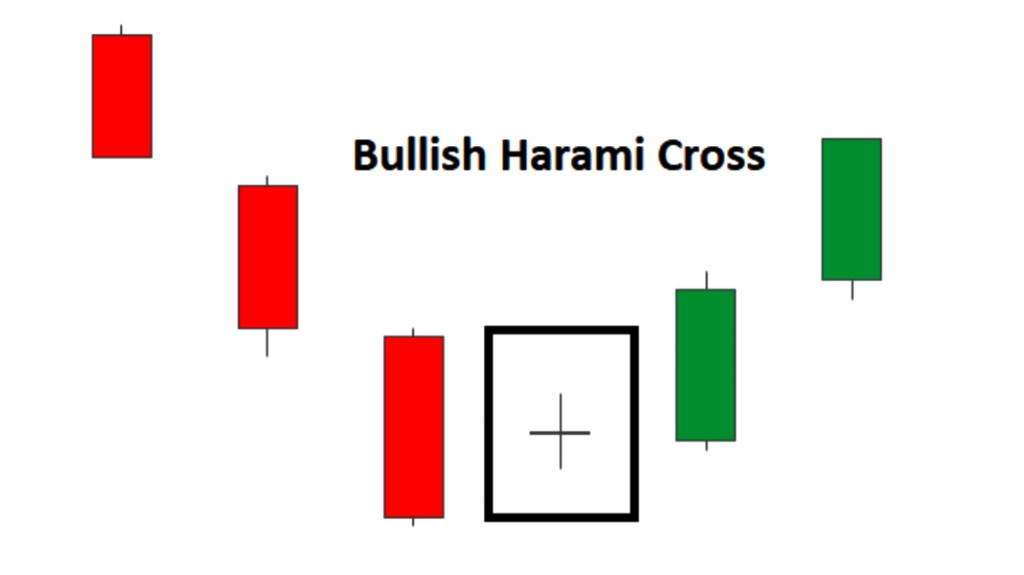
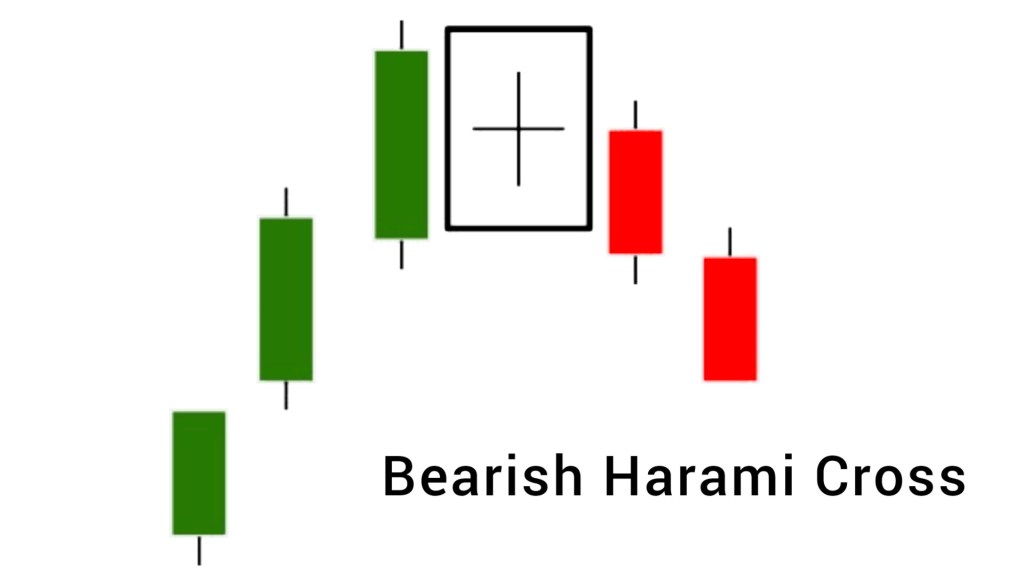
Traders look for the Harami Cross pattern as a potential reversal signal, particularly when it occurs after a strong uptrend or downtrend. The long shadow on the second candle suggests that traders are undecided about the direction of the market, which may indicate a potential change in sentiment.
It is important to note that the Harami Cross pattern is not always reliable, and traders should use it in conjunction with other technical indicators and analysis to confirm a trend reversal. Additionally, traders should be cautious when trading the Harami Cross pattern, as false signals can occur.

Leave a comment