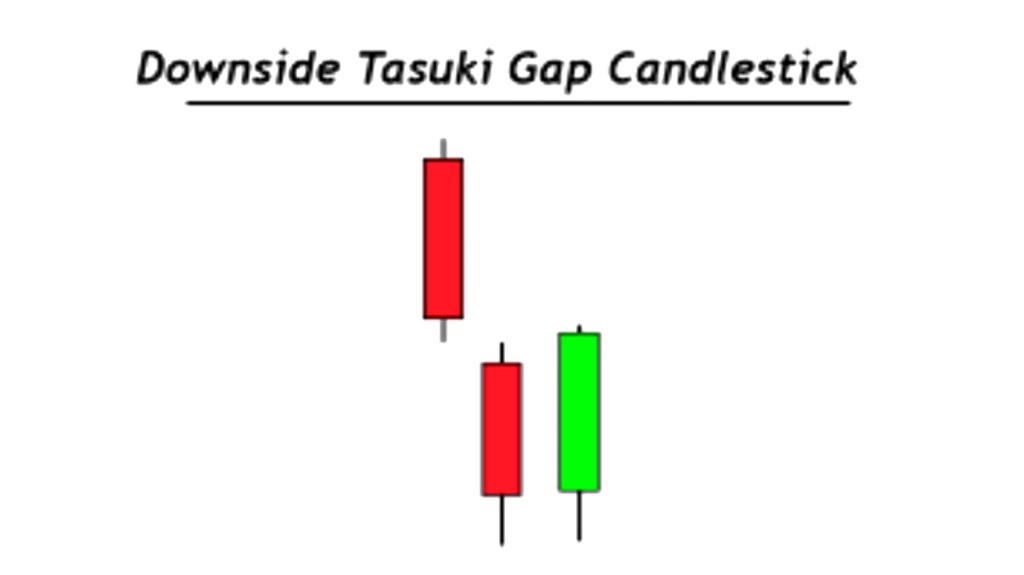
The “Downside Tasuki Gap” is a bearish candlestick pattern that indicates a potential reversal in an uptrend. The pattern is made up of three candles, with the middle candlestick forming a gap down from the previous candle, and the final candlestick closing below the middle candlestick. Here are the details of the Downside Tasuki Gap pattern:
1) The first candlestick is a bullish candle that closes near its high, signaling upward momentum in the market.
2) The second candlestick is a bearish candle that opens with a gap down from the first candlestick, indicating a sudden change in market sentiment. This candlestick should have a lower closing price than the first candlestick.
3) The third candlestick is another bearish candle that opens within the gap between the first two candlesticks and closes below the midpoint of the first candlestick. This candlestick confirms the shift in market sentiment and suggests that the bears are gaining control.
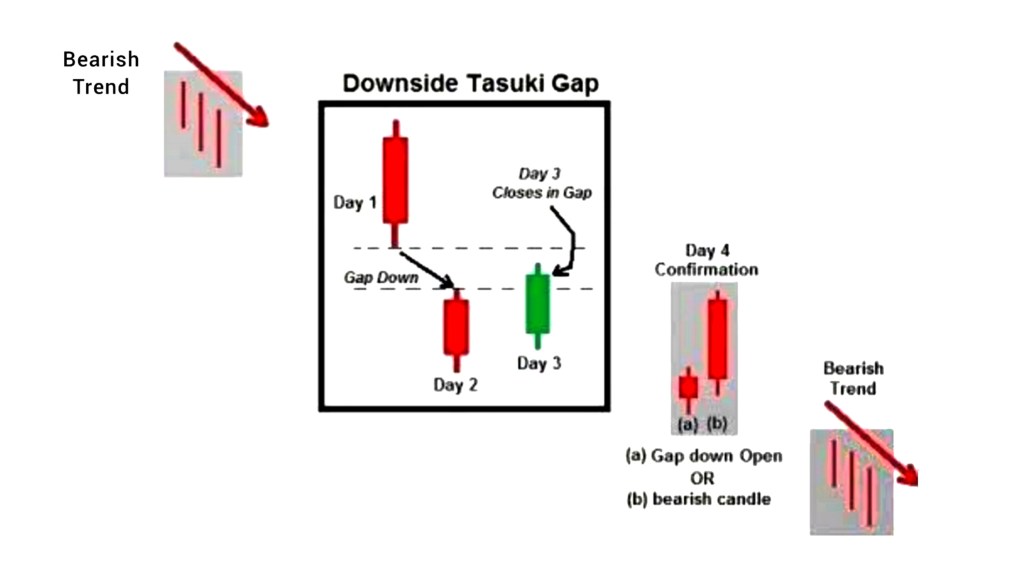
Overall, the Downside Tasuki Gap pattern suggests that the bulls have lost control of the market and that the bears are taking over.
Traders who see this pattern may consider selling or shorting the asset, especially if it occurs after a prolonged uptrend. However, it is important to note that no trading pattern is foolproof, and traders should always use other technical indicators and risk management strategies to make informed decisions.

Leave a comment