
“Bullish Meeting Lines” candlestick pattern is a two-candle pattern that can signal a potential bullish reversal in the market. It occurs when a downtrend is in progress, and the bears are in control of the market. However, during the formation of the pattern, the bulls step in and begin to push prices higher, indicating a shift in market sentiment.
Here are the details of the Bullish Meeting Lines candlestick pattern:
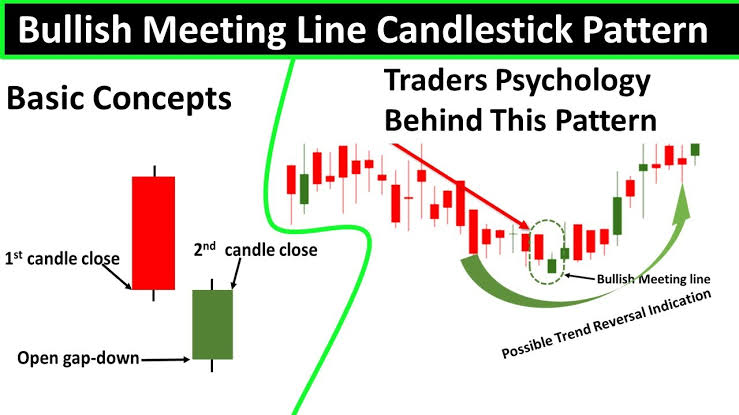
1) The pattern consists of two candles. The first candle is a bearish candle, which means that it opens above the previous day’s close and then closes lower than the opening price.
2) The second candle is a bullish candle, which means that it opens lower than the previous day’s close and then closes higher than the opening price.
3) The second candle should also close above the midpoint of the previous bearish candle.
4) The pattern shows that the bears were initially in control of the market, but the bulls stepped in and pushed prices higher, indicating a potential shift in market sentiment.
5) The pattern is stronger if the second candle has a longer real body than the first candle, indicating that the bulls are gaining momentum.
Traders often look for confirmation of the pattern with other technical indicators or chart patterns before taking a position.
The pattern is more reliable when it appears after a downtrend, as it indicates a potential reversal of the trend.
However, traders should always remember that no pattern is foolproof, and they should always use risk management strategies when trading.
In summary, the Bullish Meeting Lines candlestick pattern is a two-candle pattern that can signal a potential bullish reversal in the market. It occurs when the bulls step in and begin to push prices higher, indicating a shift in market sentiment. Traders should always use risk management strategies when trading and look for confirmation with other technical indicators or chart patterns.

Leave a comment