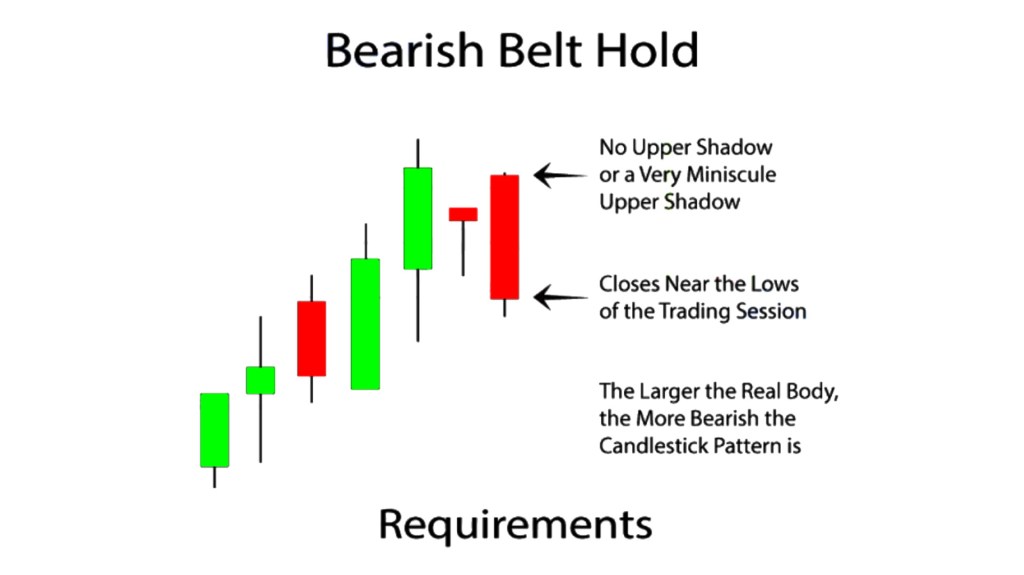
The “Bearish Belt Hold” is a candlestick pattern that indicates a possible trend reversal in a financial market. This pattern is characterized by a single candlestick with a long black or red body, and little or no upper shadow, but with a relatively long lower shadow. The body of the candlestick represents the opening and closing price of the trading session, while the shadows represent the highest and lowest prices traded during the session.
The Bearish Belt Hold pattern occurs during an uptrend when there is a sudden and strong selling pressure that pushes the price down, resulting in a long black or red candlestick that opens near the high of the day and closes near the low of the day. The absence of any upper shadow indicates that the bears were in control throughout the session and were able to keep the price from rising, while the relatively long lower shadow indicates that the bulls tried to push the price up but were unsuccessful.
This pattern is considered bearish because it suggests that the bears have taken control of the market and are likely to continue to push the price lower in the following sessions. Traders and analysts often look for confirmation of the pattern through additional technical analysis, such as volume analysis or trendline analysis, before making any trading decisions.
It is important to note that like all candlestick patterns, the Bearish Belt Hold should not be used in isolation and should be considered within the context of the overall market trend and other technical indicators. Additionally, it is important to use risk management strategies and to always have a stop loss in place when trading in financial markets.

Leave a comment