The “Bullish Harami” Pattern is a two-candlestick pattern that is commonly used in technical analysis to predict potential bullish price reversals in the financial markets. It is formed by two candlesticks, with the first candlestick being a long bearish candle and the second candlestick being a small bullish candle that is completely engulfed by the first candlestick’s body.
The term “harami” is derived from the Japanese word for “pregnant,” which refers to the smaller bullish candlestick being contained within the larger bearish candlestick, like a baby inside a mother’s womb. The bullish harami pattern suggests that the previous downtrend is losing momentum, and a new uptrend may be imminent.
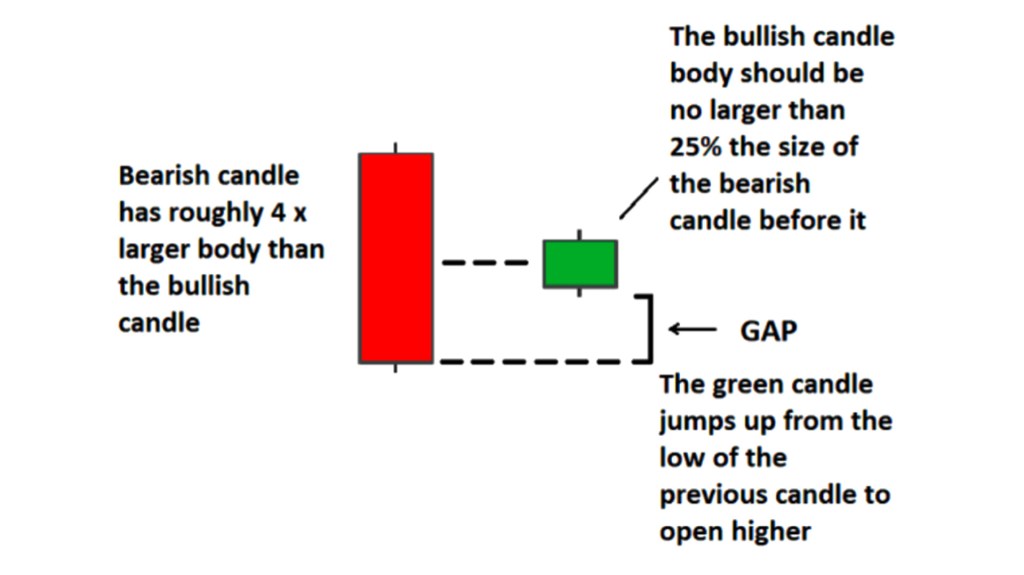
Here are the characteristics of the bullish harami pattern:
The first candlestick should be a long bearish candlestick, representing a downtrend.
The second candlestick should be a small bullish candlestick, completely engulfed by the first candlestick’s body.
The small bullish candlestick should open lower than the previous candlestick’s close and close higher than the previous candlestick’s open.
The bullish harami pattern is most reliable when it occurs after a significant downtrend.
Traders often use the bullish harami pattern as a signal to enter long positions in the market, with a stop loss order placed below the low of the bearish candlestick. The potential profit target can be determined by measuring the height of the bearish candlestick and projecting it upwards from the close of the bullish candlestick.
It’s important to note that while the bullish harami pattern can be a useful tool in technical analysis, it is not always a reliable indicator of a trend reversal. It is essential to use other technical indicators and fundamental analysis to confirm any signals provided by the bullish harami pattern.

Leave a comment