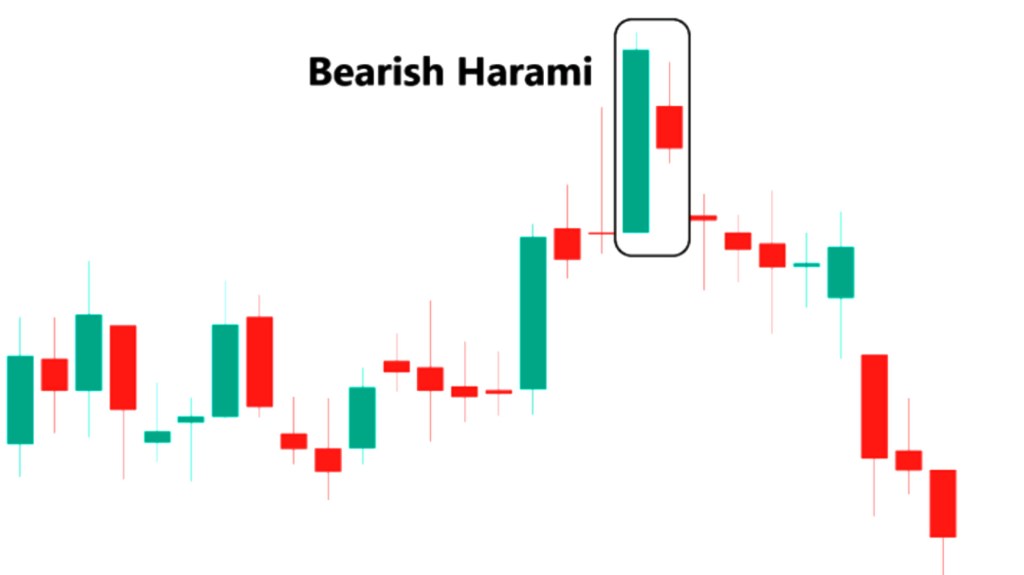
The “Bearish Harami” pattern is a popular technical analysis pattern used by traders to identify potential reversals in the market. The pattern consists of two candlesticks, where the first candlestick is a long bullish candle, and the second candlestick is a smaller bearish candlestick that is completely engulfed by the first candlestick. The Bearish Harami pattern typically signals a reversal of an uptrend and is often seen as a bearish signal.
Here are the key characteristics of the Bearish Harami pattern:
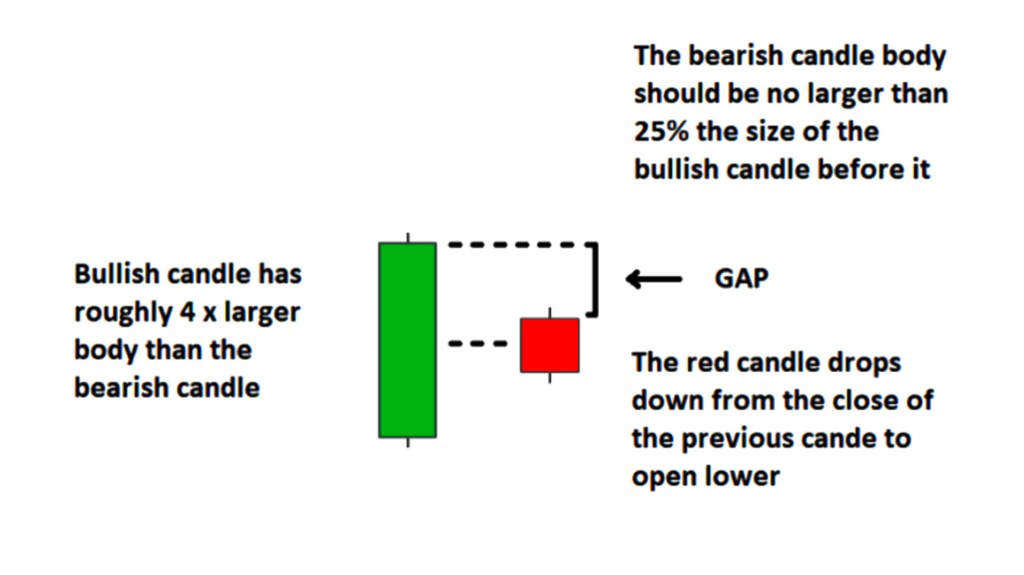
The first candlestick is a long bullish candlestick, indicating that the market is in an uptrend.
The second candlestick is a small bearish candlestick that opens higher than the previous close but then closes lower than the previous open.
The second candlestick is completely engulfed by the first candlestick, meaning that its real body is completely within the range of the first candlestick.
The Bearish Harami pattern typically signals a reversal of the uptrend and is often seen as a bearish signal.
Traders often use other technical indicators or price action signals to confirm the Bearish Harami pattern before making a trading decision.
When a Bearish Harami pattern is identified, traders will often look for other technical indicators to confirm the pattern and to confirm the potential reversal. Traders may also use price action signals, such as a break below a key support level, to confirm the pattern before making a trading decision. If the pattern is confirmed, traders may choose to take a short position in the market or exit any long positions they have.
It is important to note that, like any technical analysis pattern, the Bearish Harami pattern is not always 100% accurate, and traders should use it in conjunction with other technical analysis tools and risk management strategies to make informed trading decisions.

Leave a comment