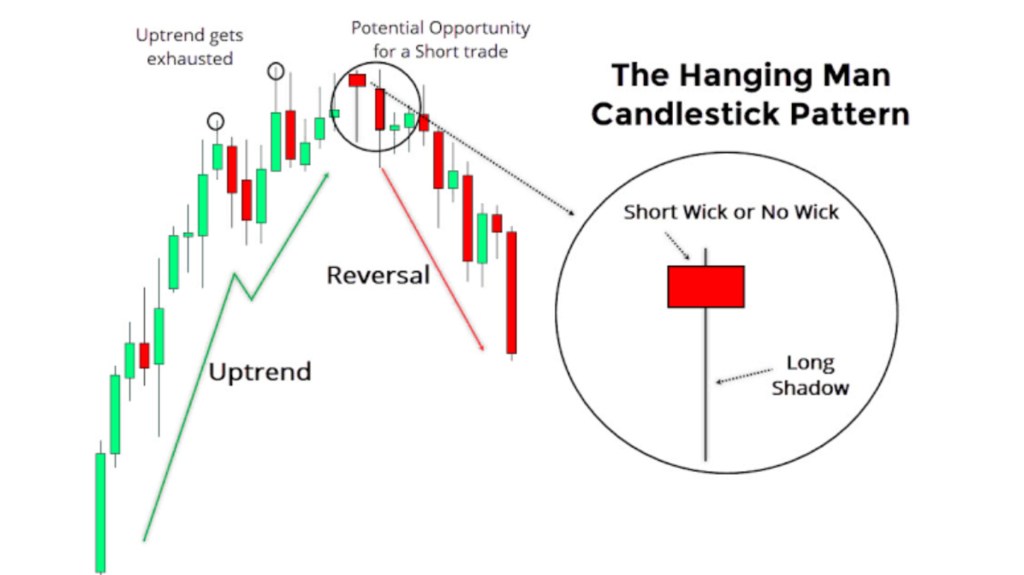
The “Hanging Man” is a candlestick pattern used in technical analysis to help identify potential reversals in an asset’s price movement. It is a single candlestick pattern that is formed when the price opens high, trades lower throughout the day, and then closes near its opening price.
The Hanging Man gets its name from the way it looks, which resembles a person hanging from a noose. The pattern is characterized by a small body with a long lower shadow, and little or no upper shadow. The long lower shadow indicates that there was significant selling pressure during the trading day, but the price managed to recover and close near its opening price.
The Hanging Man pattern is considered a bearish signal when it appears after an uptrend, as it indicates that the buying pressure that drove the price up is starting to weaken. However, it is not a strong signal on its own and should be used in combination with other technical indicators to confirm a potential reversal.
Traders who use the Hanging Man pattern as part of their analysis may look for confirmation in the form of a gap down on the next trading day or a break below the low of the Hanging Man candle. If either of these events occurs, it can be seen as a more reliable signal that the asset’s price may be reversing.

Leave a comment