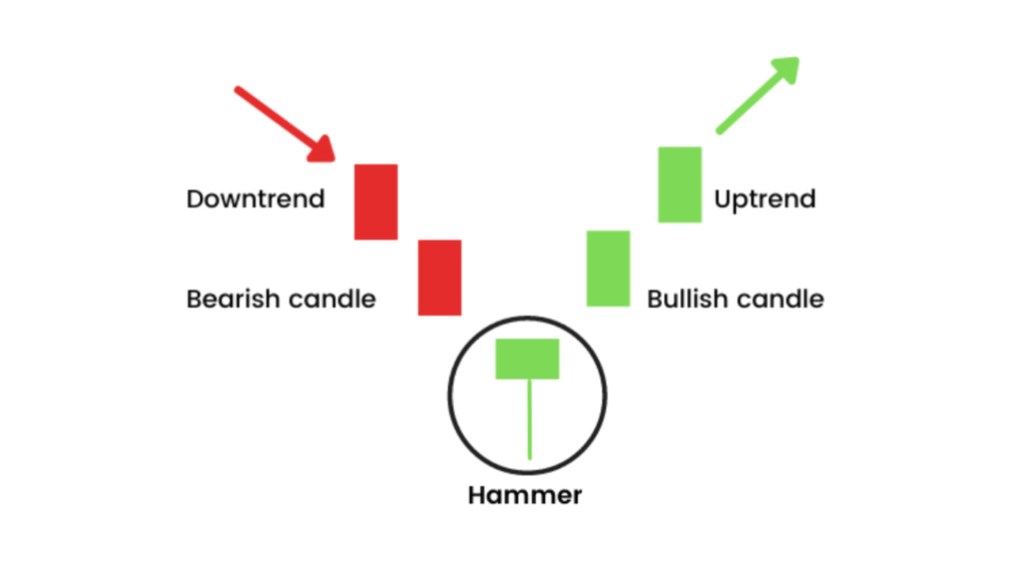
The “Hammer” candlestick pattern is a popular technical analysis tool used by traders to identify potential bullish reversals in the market. It is a single candlestick pattern that forms at the end of a downtrend, and it is characterized by a long lower wick, a small real body, and little or no upper wick.
The hammer candlestick pattern is formed when the opening and closing prices are very close to each other, and there is a significant difference between the high and low prices of the candlestick. The long lower wick represents the strong buying pressure that pushed the price up from the low of the session, while the small real body shows that the buyers were able to hold their ground and push the price higher, even in the face of selling pressure.
To identify a hammer candlestick pattern, traders look for a candlestick with a long lower wick that is at least two times the size of the real body. Additionally, the real body should be at the upper end of the candlestick, with little or no upper wick.
When a hammer candlestick pattern forms at the end of a downtrend, it is seen as a bullish signal, suggesting that the sellers may have exhausted their momentum and the buyers are stepping in. Traders often look for confirmation of this signal by watching for follow-through buying in the next candlestick or the next few sessions.
It’s important to note that while the hammer candlestick pattern is a popular tool for identifying potential bullish reversals, it should be used in combination with other technical indicators and analysis methods to make informed trading decisions. Additionally, like all technical analysis tools, the hammer candlestick pattern is not foolproof and should be used in conjunction with sound risk management practices.

Leave a comment