The “Bullish Engulfing” Pattern is a two-candlestick pattern that is typically found on price charts. It signals a potential reversal of a downtrend, with the bullish candlestick completely engulfing the prior bearish candlestick.
Here are the key characteristics of the Bullish Engulfing Pattern:
Downtrend: The pattern should be preceded by a downtrend. This means that the prior candlestick should have a bearish close, and the stock or asset should be in a general downtrend.
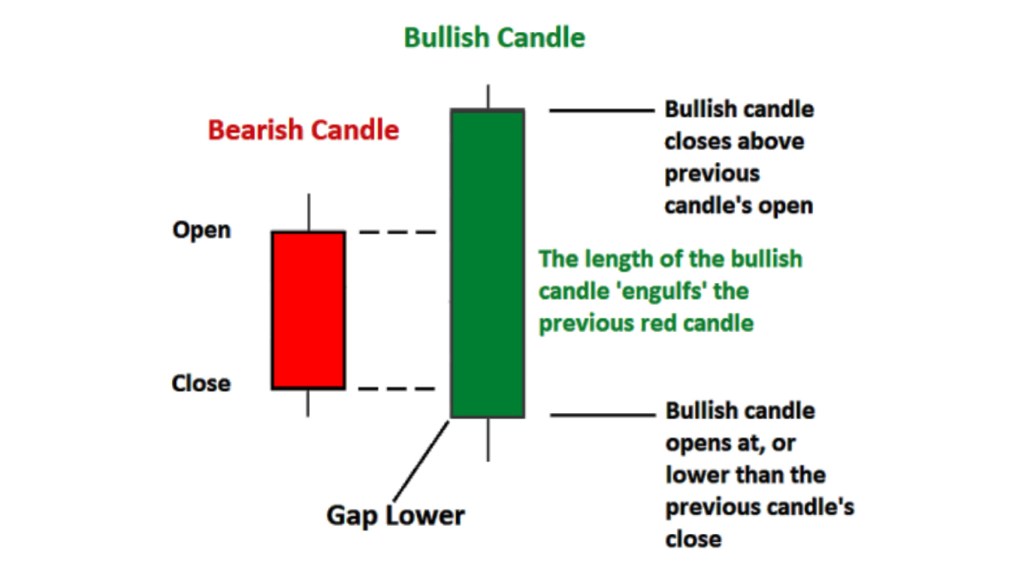
First Candle: The first candle in the pattern is a bearish candlestick. It can be any bearish candlestick, but it should have a real body that is not too small. This candle shows that the bears are in control of the market.
Second Candle: The second candle in the pattern is a bullish candlestick that completely engulfs the prior bearish candlestick. This means that the opening price of the bullish candlestick is lower than the closing price of the prior bearish candlestick, and the closing price of the bullish candlestick is higher than the opening price of the prior bearish candlestick. This indicates that the bulls have taken control of the market and are likely to continue pushing prices higher.
Volume: Volume is an important factor to consider when identifying a Bullish Engulfing Pattern. Typically, the volume should be higher on the bullish candlestick than on the prior bearish candlestick. This indicates that there is strong buying pressure behind the move.
Confirmation: A Bullish Engulfing Pattern is considered confirmed when the price of the asset or stock continues to rise after the pattern has formed. Traders and investors may use other technical indicators or analysis to confirm the pattern and determine whether it is a good time to buy.
Overall, the Bullish Engulfing Pattern is a powerful bullish signal that can indicate a potential reversal in a downtrend. However, traders and investors should use other forms of analysis to confirm the pattern and make informed trading decisions.

Leave a comment