Fundamental analysis is done in two ways:
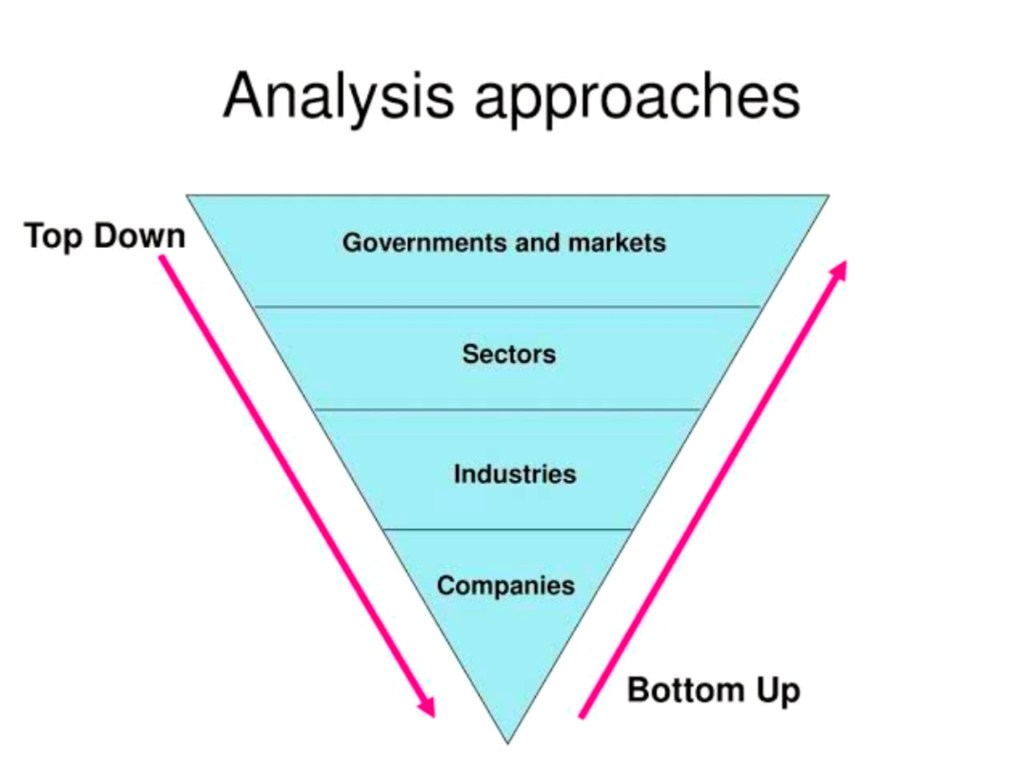
1. Top Down Approach
As the name suggests, a top to down approach is adopted. The analysis begins with overall conditions of the economy, narrows down to sectors poised to perform well depending on the various factors playing out in the economy (Like pharma sector was expected to do well as the Covid-19 pandemic spread out), and then individual stocks are chosen from the narrowed down sectors.
2. Bottom-Up Approach
This is the opposite of the top-down approach. Here, you start by identifying a company that you could be interested to invest in and then go upwards. Check on the sector that it is operating in and then take stock of the general economic conditions of the country or regions the company operates in.
You will be learning about more financial ratios and technical analysis in my up comming blogs. Here are a few of them you as a beginner can start with.
Commonly used metrics in fundamental analysis are:
Price to book ratio:
Price to book value ratio is the measure of the market value of the shares compared with the book value of the shares. The mathematical formula for this ratio is dividing the market value of the shares by the book value of the shares. This ratio helps the investor to find the organizations having the highest growth potential in any industry. The book value of shares in this case is arrived by deducting the book value of liabilities from the book value of assets. A company having a low P/B ratio reflects on the undervaluation of the stock.
Earnings per share:
Earning per share is the earnings that are earned by the shareholders for each share held by them. A higher EPS than the industry average indicates that the company is performing better than its peers in the industry. A company consistently providing higher EPS will be a preferred stock by the investors.
Price to earnings ratio:
Price to earnings ratio is one of the traditional methods to analyse the company performance and predict the prices of the stock of the company. This ratio considers the market price of the shares of the company and the earnings per share (EPS) of the company. If the PE ratio is favourable than the industry standards, the company is considered to be in a better position than its peers. It is a relatively outdated tool that is not used anymore by most analysts as a primary measure to predict the stock prices.
Return on equity:
The return on equity is one of the most important measures of a company’s profitability. A higher ROI will assure the investors of the profitability of the company and will eventually lead to an increase in the trade volume and prices of the stock.
Price to earnings to growth ratio:
Price to earnings to growth ratio is the addition to the price to earnings ratio. This ratio provides a better yardstick to measure the performance of the company and thereby predict the prices of the stock. The main feature of this ratio is that it considers the growth of the company to measure its performance and eventually predict the stock prices the following day.
Common metrics used in technical analysis are:
Simple Moving Averages:
By using this metric, you try to even out the day-to-day movements of the stock by taking averages for a certain number of days, say 1 week, 10 days, 1month, 3 months etc.
Exponential moving averages:
An exponential moving average is a weighted moving average that assigns more importance to recent price movements than the older ones.
Candlestick patterns:
In this metric, candle stick like images are plotted for each day of trade for a stock. It involves data points like opening price, closing price, the range, etc. When candlestick images are plotted for a number of days, there are patterns that emerge based on which trading/investing decisions are taken.
Volume breakouts:
This metric involves identifying a pattern when the stock breaks out of its set patterns with huge volumes. This signifies a change in the trend of the stock price.
Momentum indicators:
Several metrics that indicate the momentum of the stock like Stochastic Oscillator, Relative Strength Index, Moving Average Convergence Divergence are also used as metrics to predict if the movement in stock prices is a change in trend or a range bound movement, or an insignificant movement.
Conclusion
There is no correct way to predict the stock prices with 100% accuracy. Most expert analysts on many occasions fail to predict the stock prices or the prediction of movement of stock with even 60% to 80% accuracy. Investors should consider multiple parameters to ensure that they can predict the stock price to the closest possible range and accordingly make investment decisions. In most cases, the human intelligence factor is one of the most important decision making parameters in predicting the stock prices for the next day.
If this article added value to your knowledge, please upvote & share this article with your family members and friends and don’t forget to follow me and my space for more such intresting articles.
Thanks!

Leave a comment